Press Release
Free Access
Fig. 2
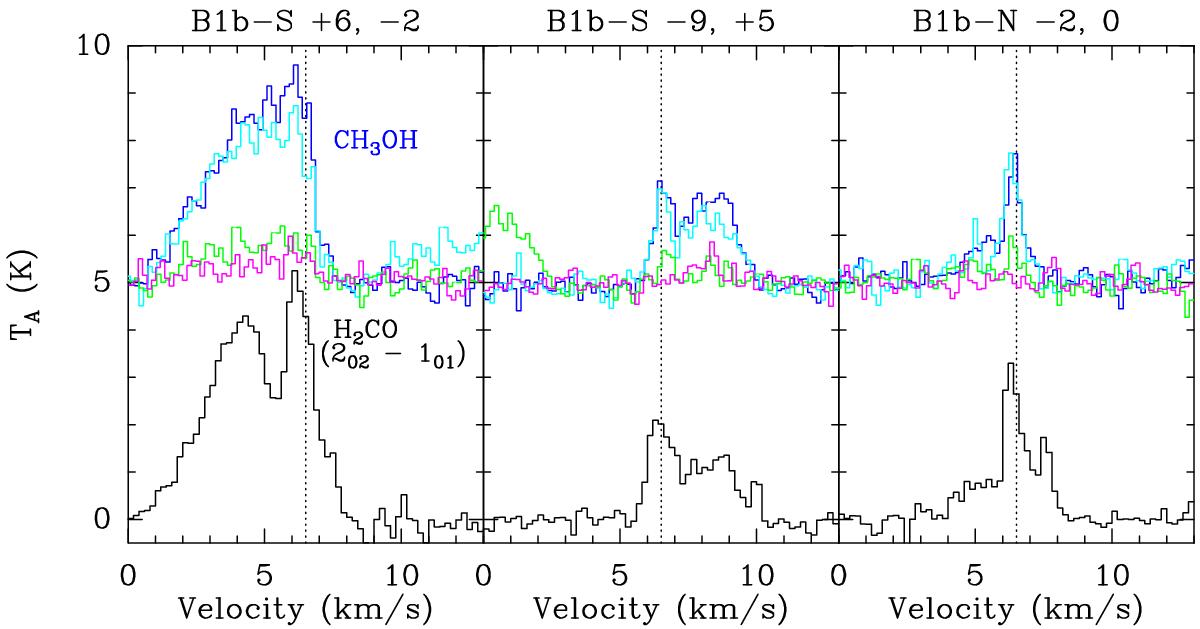
Examples of CH3OH and H2CO spectra towards the B1b-S and B1b-N outflows. The H2CO(202 − 101) line is shown in black. The four detected CH3OH lines are shown in color: blue 30 − 20 A, cyan 3-1 − 2-1 E, green 30 − 20 E, and purple 32 − 22 E. They have been vertically shifted by 5 K for clarity.
Current usage metrics show cumulative count of Article Views (full-text article views including HTML views, PDF and ePub downloads, according to the available data) and Abstracts Views on Vision4Press platform.
Data correspond to usage on the plateform after 2015. The current usage metrics is available 48-96 hours after online publication and is updated daily on week days.
Initial download of the metrics may take a while.