Fig. 1
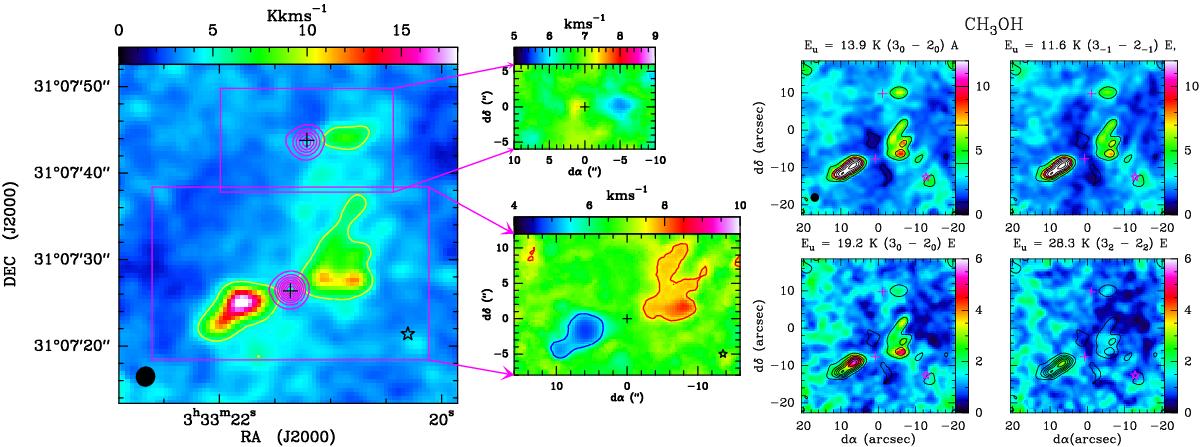
Left: integrated intensity (from 0 to 14 km s-1) and velocity field of the H2CO(20,2−10,1) line. Purple contours show the continuum emission at 145 GHz. The plus signs indicate the positions of B1b-N and B1b-S. The star shows the position of B1b-W. The black ellipse shows the beam size. The small panels show the centroid velocity towards B1b-N (top) and B1b-S (bottom) in km s-1. Right: integrated intensity images (from 1.5 to 12.5 km s-1) of the four CH3OH lines detected towards B1b: from left to right and top to bottom: 30−20 A, 3-1 − 2-1 E, 30−20 E and 32−22 E. The intensity scale in K km s-1 is given by the color bar on the right. Contours of the 30−20 A line are superimposed in all plots, ranging from 1 to 20 K km s-1 with a step of 3 K km s-1. Offsets are given relative to the pointing center given in Table 1.
Current usage metrics show cumulative count of Article Views (full-text article views including HTML views, PDF and ePub downloads, according to the available data) and Abstracts Views on Vision4Press platform.
Data correspond to usage on the plateform after 2015. The current usage metrics is available 48-96 hours after online publication and is updated daily on week days.
Initial download of the metrics may take a while.