| Issue |
A&A
Volume 577, May 2015
|
|
|---|---|---|
| Article Number | A15 | |
| Number of page(s) | 4 | |
| Section | Stellar structure and evolution | |
| DOI | https://doi.org/10.1051/0004-6361/201525757 | |
| Published online | 24 April 2015 | |
Astrometric planet search around southern ultracool dwarfs
III. Discovery of a brown dwarf in a 3-year orbit around DE0630−18⋆
1
European Space Agency, European Space Astronomy Centre, PO Box 78,
Villanueva de la Cañada,
28691
Madrid,
Spain
e-mail:
johannes.sahlmann@esa.int
2
Main Astronomical Observatory, National Academy of Sciences of the
Ukraine, Zabolotnogo
27, 03680
Kyiv,
Ukraine
3
Observatoire de Genève, Université de Genève,
51 chemin Des Maillettes,
1290
Versoix,
Switzerland
4
INTA-CSIC Centro de Astrobiología, 28850
Torrejón de Ardoz, Madrid, Spain
5
University of Cambridge, Cavendish Laboratory,
J J Thomson Avenue,
Cambridge, CB3 0HE, UK
Received: 27 January 2015
Accepted: 26 February 2015
Using astrometric measurements obtained with the FORS2/VLT camera, we are searching for low-mass companions around 20 nearby ultracool dwarfs. With a single-measurement precision of ~0.1 milli-arcsec, our survey is sensitive to a wide range of companion masses from planetary companions to binary systems. Here, we report the discovery and orbit characterisation of a new ultracool binary at a distance of 19.5 pc from Earth that is composed of the M8.5-dwarf primary DE0630−18 and a substellar companion. The nearly edge-on orbit is moderately eccentric (e = 0.23) with an orbital period of 1120 d, which corresponds to a relative separation in semimajor axis of approximately 1.1 AU. We obtained a high-resolution optical spectrum with UVES/VLT and measured the system’s heliocentric radial velocity. The spectrum does not exhibit lithium absorption at 670.8 nm, indicating that the system is not extremely young. A preliminary estimate of the binary’s physical parameters tells us that it is composed of a primary at the stellar-substellar limit and a massive brown-dwarf companion. DE0630−18 is a new very low-mass binary system with a well-characterised orbit.
Key words: stars: low-mass / brown dwarfs / planetary systems / binaries: close / astrometry / techniques: spectroscopic
© ESO, 2015
1. Introduction
Using astrometry with the FORS2 optical camera (Appenzeller et al. 1998), installed at the Very Large Telescope (VLT) of the European Southern Observatory (ESO), we are searching for planetary companions of 20 southern ultracool dwarfs with spectral types M8–L2. The project is described in Sahlmann et al. (2014b), and its first result, the discovery of a low-mass companion to an L dwarf, is reported in Sahlmann et al. (2013) and updated by Sahlmann et al. (2014c). Details on the astrometric reduction methods are given in Lazorenko et al. (2014).
Here, we report the discovery of the binary nature of DENIS J063001.4-184014, hereafter DE0630−18, revealed by ground-based astrometric monitoring over more than three years. The primary is a very-low-mass star or brown dwarf with an optical spectral type of M8.5 (Phan-Bao et al. 2008), and the companion responsible for the astrometric orbit is a brown dwarf.
2. Observations and data reduction
DE0630−18 was observed as part of our astrometric planet search and the FORS2 data were reduced as described in Lazorenko et al. (2014). The position of the target was repeatedly measured relative to reference stars in the 4′× 4′ field of view. DE0630−18 has an I-band magnitude of 15.7 and we observed it on 23 epochs over a timespan of 1209 d between 2010 December 7 and 2014 March 30. On average, we obtained 44 frames per epoch. In June 2012, it became clear that the standard astrometric model is not sufficient to explain the motion of DE0630−18, and we initiated follow-up observations. We followed the same strategy and procedures for the adjustment of an additional Keplerian motion that is described in Sahlmann et al. (2013). A genetic algorithm was used to efficiently explore the large parameter space and to identify the most promising model parameters. These provided the starting values for a Markov-chain Monte Carlo (MCMC) analysis that yielded the final parameters and their confidence intervals and correlation estimates.
We also observed DE0630−18 on 2013 October 3 (MJD1 56 568.350793) with the red arm of UVES at the VLT (Dekker et al. 2000) using a  slit width, which provided a resolving power of R ~ 33 000, and the Dichroic 2 standard setup centred at 760 nm to cover the wavelength range of 565−931 nm. The exposure time was 2100 s and the observation took place with 0.̋77 optical seeing at an airmass of 1.10. The spectrum was reduced using the ESO pipeline in standard setup. We measured the radial velocity on the UVES spectrum using strong atomic lines (Rb i and Cs i) with the method described in Sahlmann et al. (2014c) and determined a heliocentric radial velocity of −13.0 ± 1.1 km s-1.
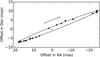 |
Fig. 1 Photocentric orbit of DE0630−18 caused by the gravitational pull of the orbiting brown dwarf. Observations and the best-fit model are shown as black circles and a grey curve, respectively. Uncertainties are smaller than the symbol size. The barycentre and periastron position are marked with a cross and an open square, respectively. The orbital motion is clockwise; north is up and east is left. |
Orbital parameters of the DE0630−18 system.
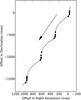 |
Fig. 2 Proper and parallactic motion of DE0630−18 relative to the field of reference stars. The astrometric observations and the model are shown as black circles and grey curve, respectively. The black arrow indicates the direction and amplitude of the proper motion over one year. |
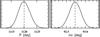 |
Fig. 3 Marginal distribution of the orbital period (left) and inclination (right) for DE0630−18 obtained from 1.5 × 10⁶ MCMC iterations. The dashed line indicates the median value and the Y-coordinate units are arbitrary and indicate relative occurrence. |
3. The photocentre orbit of DE0630−18
The photocentre orbit of DE0630−18 is shown in Figs. 1 and 4. Compared to the measurement precision, the photocentre semimajor axis of 23.4 milli-arcseconds (mas) is very large. The orbit is seen almost edge-on. Figure 2 shows the proper and parallactic motion of the DE0630−18 system relative to the background stars, which is one order of magnitude larger than the orbital motion.
The orbit fit parameters and their confidence intervals are reported in Table 1, where  and Δδ0 are relative offsets to the target’s position at the reference date TRef taken as the arithmetic mean of the observation dates, ϖ is the relative parallax, μα⋆ and μδ are the proper motions, e is the eccentricity, ω is the argument of periastron, P is the orbital period, λRef is the mean longitude at time TRef, Ω is the ascending node, i is the orbit’s inclination, and α is the semi-major axis of the photocentric orbit. The parameters ρ and d model the differential chromatic refraction and sα and sδ are nuisance parameters. The astrometric data constrains all orbital parameters well, which leads to normally-distributed parameters and small fractional uncertainties, see Fig. 3. The parallax correction Δϖ was determined in Sahlmann et al. (2014b) and yields the absolute parallax ϖabs. The time of periastron passage T0 can be retrieved via the mean anomaly
 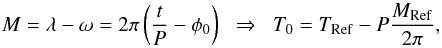 (1)where t is time and φ0 = T0/P is the phase at periastron.
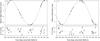 |
Fig. 4 Photocentre orbit motion of DE0630−18 as a function of time. The orbital signature in Right Ascension (panel a)) and declination (panel c)) is shown, where black symbols show the epoch average values. Panels b) and d): observed minus calculated (O−C) residuals of epoch averages. |
On the basis of the FORS2 astrometry, we have accurately determined the photocentre orbit of DE0630−18, in particular its semimajor axis and period. Additionally, we measured the absolute parallax, thus know the system’s distance from Earth. Despite the nearly edge-on configuration, the binary is unlikely to eclipse because of the large orbital separation between two approximately Jupiter-sized bodies.
4. Preliminary constraints on the individual components
In Sahlmann et al. (2014b), we estimated a mass of M1 = 0.086 ± 0.009 M⊙ for the primary DE0630−18A. Should the system’s photocentre and barycentre coincide, the measured orbit corresponds to a mass of M2 ≃ 0.060 M⊙ for the companion DE0630−18B. However, at this mass ratio q = M2/M1 ≃ 0.70, the optical light contribution of the secondary can be significant and the photocentric and barycentric orbits may be different.
The difference between a binary’s photocentre and barycentre orbit size is determined by the magnitude difference Δm between the components and their individual masses. The fractional mass f = M2/ (M1 + M2) and the fractional luminosity β = L2/ (L1 + L2) = (1 + 100.4Δm)-1, define the relationship between the semimajor axis α of the photocentre orbit and the semimajor axis arel of the relative orbit, where both are measured in mas: 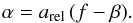 (2)An independent constraint on the relative semimajor axis is given by Kepler’s law
 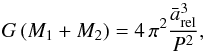 (3)where G is the gravitational constant,
  is measured in metres and P is in seconds. The relation between and arel is given by the parallax ϖabs.
Because we have knowledge of α, P, and ϖabs only, the problem is underconstrained. To obtain a preliminary estimate of the possible values for individual masses, we therefore have to make use of theoretical mass-luminosity-age relationships. For a range of companion masses M2 and a constant primary mass M1, we used the BT-Settl (Allard et al. 2012) and DUSTY (Chabrier et al. 2000) models to obtain the corresponding magnitude difference ΔmI in the I-band for ages  1 Gyr. Because we have measured α, Eq. (2) yields the estimate
  for the relative semimajor axis. On the other hand, we know the orbital period and the parallax, thus Eq. (3) gives us a second estimate
  of the relative semimajor axis. The only possible values of M2 are the ones where the identity
  is fulfilled.
In Fig. 5, we show the relations between and  for different system ages. The dashed grey line indicates equality and isolates two values of M2 that are allowed for every age. The main drawback of this method is that it relies on models that may not be well calibrated in the respective mass and age range. However, it allows us to draw first preliminary conclusions on the system parameters.
According to Fig. 5, the system has to be older than 1 Gyr because the requirement cannot be met at this age. This is compatible with the non-detection of Li i absorption in our UVES spectrum of DE0630−18. Because objects with masses ≳0.06 M⊙ deplete their lithium content within the first hundred million years of existence, the lithium test (e.g. Magazzu et al. 1993) yields a constraint on mass and/or age of ultracool dwarfs. For DE0630−18, the Li test is negative, thus DE0630−18 is not very young, in agreement with the constraint from the orbit modelling.
Possible secondary masses are found at ages of 3, 5, and 7 Gyr, where the secondary can have a mass of M2 ≃ 0.075 M⊙ or of M2 ≃ 0.060 M⊙. These two solutions correspond to scenarios where the companion is very massive and luminous, thus contributes significantly to the photocentre-to-barycentre shift, and where the secondary is less massive, leading to a smaller orbit and smaller photocentre-to-barycentre shift, respectively. Table 2 lists the model-dependent values of secondary mass, relative separation, magnitude difference in red and infrared bands, and the difference between the photocentre orbit size and the primary’s barycentric orbit size (α − a1) for all solutions. The binary separation is in the ~57−59 mas range and the magnitude differences range between 2.9 and 13.3 in the I-band and between 1.1 and 5.3 in the infrared K-band.
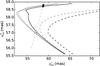 |
Fig. 5 Relative semimajor axis of DE0630−18 obtained from two estimators using the mass-luminosity-age relationships according to BT-Settl (black curves) for ages of 1 Gyr (dashed), 3 Gyr (solid), and 7 Gyr (dotted) and DUSTY (thick grey curves) for ages of 1 Gyr (dashed) and 5 Gyr (solid). The secondary mass increases from 0.050M⊙ to 0.076 M⊙ upwards along every curve. Allowed values are marked with open and filled circles. |
Theoretical constraints on secondary masses and magnitudes according to BT-Settl and DUSTY models.
5. Discussion
Astrometric monitoring of the ultracool dwarf DE0630−18 led to the discovery of its binary nature and allowed us to determine all orbital parameters with high precision. Because the photocentric motion in I-band may be diluted by the companion’s emission, additional constraints are required to characterise the individual binary components. Theoretical models of substellar evolution point towards system age older than 1 Gyr and a primary mass of M1 = 0.086 ± 0.009 M⊙. The secondary mass has two allowed modes at ~0.06 M⊙ and ~0.075 M⊙, which in both cases indicates a substellar nature, i.e. the companion is a brown dwarf. From our astrometric and spectroscopic observations alone, we cannot distinguish between these two modes. However, we note that DE0630−18 is not overluminous in the Wide-field Infrared Survey Explorer (WISE; Wright et al. 2010) bands W1, W2 (shown in Fig. 6), and W3 compared to the population of ultracool dwarfs, which points towards the lower mass for the companion. In Fig. 6, the juvenile binary DE0823−49 (L1.5, Sahlmann et al. 2014c) appears slightly overluminous. The seemingly overluminous object is DE1733−16 (L1), which is probably caused by blending with a background source in this extremely dense starfield.
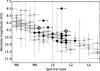 |
Fig. 6 Absolute magnitude in the W2-band (~4.6 μm) as a function of spectral type for M6–L5 dwarfs in the database of ultracool parallaxes (Dupuy & Liu 2012; grey symbols) and for our survey sample with parallaxes from (Sahlmann et al. 2014b; black symbols). Magnitude uncertainties of the latter are smaller than the symbol size. Tight binaries in our sample are shown with open circles. DE0630−18 (M8.5) is seen to have a magnitude similar to other ultracool dwarfs. |
Figure 7 shows the expected radial velocity curve in this scenario. Our UVES measurement was taken close to a time of zero orbital radial velocity, which allows us to determine the heliocentric systemic velocity as either −12.2 ± 1.1 km s-1 or −13.8 ± 1.1 km s-1 (for the opposite orbit orientation with i′ = i + 180°). Clearly, the radial velocity variations along the orbit are detectable with follow-up measurements using UVES or other spectrographs.
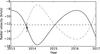 |
Fig. 7 Estimated radial velocity curve of DE0630−18A (M1 = 0.086 M⊙, M2 = 0.061 M⊙) as a function of time. The UVES measurement is shows with a solid circle and the systemic velocity is indicated by the horizontal dashed line. The dash-dotted line corresponds to the alternative radial velocity curve with i′ = i + 180°. |
A more detailed characterisation of the binary components of DE0630−18 requires additional observations. The relative proximity (19.5 pc) and brightness (mI ≃ 15.7, mJ ≃ 11.3) of this system will facilitate these and possibly lead to new insights into the properties of ultracool dwarfs.
The case of DE0630−18 illustrates the potential difficulties when trying to characterise ultracool binary stars from the photocentric orbit alone, which will also arise for the hundreds of orbits (Sahlmann et al. 2014a) expected from the astrometric survey of the Gaia mission.
Acknowledgments
J.S. is supported by an ESA Research Fellowship in Space Science. This research made use of the databases at the Centre de Données astronomiques de Strasbourg (http://cds.u-strasbg.fr), NASA’s Astrophysics Data System Service (http://adsabs.harvard.edu/abstract_service.html), the paper repositories at arXiv, and of Astropy, a community-developed core Python package for Astronomy (Astropy Collaboration et al. 2013).
References
- Allard, F., Homeier, D., & Freytag, B. 2012, Roy. Soc. London Phil. Trans. Ser. A, 370, 2765 [Google Scholar]
- Appenzeller, I., Fricke, K., Fürtig, W., et al. 1998, The Messenger, 94, 1 [NASA ADS] [Google Scholar]
- Astropy Collaboration,Robitaille, T. P., Tollerud, E. J., et al. 2013, A&A, 558, A33 [NASA ADS] [CrossRef] [EDP Sciences] [Google Scholar]
- Chabrier, G., Baraffe, I., Allard, F., & Hauschildt, P. 2000, ApJ, 542, 464 [NASA ADS] [CrossRef] [Google Scholar]
- Dekker, H., D’Odorico, S., Kaufer, A., Delabre, B., & Kotzlowski, H. 2000, SPIE, 4008, 534 [Google Scholar]
- Dupuy, T. J., & Liu, M. C. 2012, ApJS, 201, 19 [NASA ADS] [CrossRef] [Google Scholar]
- Lazorenko, P. F., Sahlmann, J., Ségransan, D., et al. 2014, A&A, 565, A21 [NASA ADS] [CrossRef] [EDP Sciences] [Google Scholar]
- Magazzu, A., Martin, E. L., & Rebolo, R. 1993, ApJ, 404, L17 [NASA ADS] [CrossRef] [Google Scholar]
- Phan-Bao, N., Bessell, M. S., Martín, E. L., et al. 2008, MNRAS, 383, 831 [NASA ADS] [CrossRef] [Google Scholar]
- Sahlmann, J., Lazorenko, P. F., Ségransan, D., et al. 2013, A&A, 556, A133 [NASA ADS] [CrossRef] [EDP Sciences] [Google Scholar]
- Sahlmann, J., Lazorenko, P. F., Segransan, D., et al. 2014a, Solar and Stellar Astrophysics [arXiv:1407.0590] [Google Scholar]
- Sahlmann, J., Lazorenko, P. F., Ségransan, D., et al. 2014b, A&A, 565, A20 [NASA ADS] [CrossRef] [EDP Sciences] [Google Scholar]
- Sahlmann, J., Lazorenko, P. F., Ségransan, D., et al. 2014c, A&A, submitted [Google Scholar]
- Wright, E. L., Eisenhardt, P. R. M., Mainzer, A. K., et al. 2010, AJ, 140, 1868 [NASA ADS] [CrossRef] [Google Scholar]
All Tables
Theoretical constraints on secondary masses and magnitudes according to BT-Settl and DUSTY models.
All Figures
|
Fig. 1 Photocentric orbit of DE0630−18 caused by the gravitational pull of the orbiting brown dwarf. Observations and the best-fit model are shown as black circles and a grey curve, respectively. Uncertainties are smaller than the symbol size. The barycentre and periastron position are marked with a cross and an open square, respectively. The orbital motion is clockwise; north is up and east is left. |
| In the text | |
|
Fig. 2 Proper and parallactic motion of DE0630−18 relative to the field of reference stars. The astrometric observations and the model are shown as black circles and grey curve, respectively. The black arrow indicates the direction and amplitude of the proper motion over one year. |
| In the text | |
|
Fig. 3 Marginal distribution of the orbital period (left) and inclination (right) for DE0630−18 obtained from 1.5 × 10⁶ MCMC iterations. The dashed line indicates the median value and the Y-coordinate units are arbitrary and indicate relative occurrence. |
| In the text | |
|
Fig. 4 Photocentre orbit motion of DE0630−18 as a function of time. The orbital signature in Right Ascension (panel a)) and declination (panel c)) is shown, where black symbols show the epoch average values. Panels b) and d): observed minus calculated (O−C) residuals of epoch averages. |
| In the text | |
|
Fig. 5 Relative semimajor axis of DE0630−18 obtained from two estimators using the mass-luminosity-age relationships according to BT-Settl (black curves) for ages of 1 Gyr (dashed), 3 Gyr (solid), and 7 Gyr (dotted) and DUSTY (thick grey curves) for ages of 1 Gyr (dashed) and 5 Gyr (solid). The secondary mass increases from 0.050M⊙ to 0.076 M⊙ upwards along every curve. Allowed values are marked with open and filled circles. |
| In the text | |
|
Fig. 6 Absolute magnitude in the W2-band (~4.6 μm) as a function of spectral type for M6–L5 dwarfs in the database of ultracool parallaxes (Dupuy & Liu 2012; grey symbols) and for our survey sample with parallaxes from (Sahlmann et al. 2014b; black symbols). Magnitude uncertainties of the latter are smaller than the symbol size. Tight binaries in our sample are shown with open circles. DE0630−18 (M8.5) is seen to have a magnitude similar to other ultracool dwarfs. |
| In the text | |
|
Fig. 7 Estimated radial velocity curve of DE0630−18A (M1 = 0.086 M⊙, M2 = 0.061 M⊙) as a function of time. The UVES measurement is shows with a solid circle and the systemic velocity is indicated by the horizontal dashed line. The dash-dotted line corresponds to the alternative radial velocity curve with i′ = i + 180°. |
| In the text | |
Current usage metrics show cumulative count of Article Views (full-text article views including HTML views, PDF and ePub downloads, according to the available data) and Abstracts Views on Vision4Press platform.
Data correspond to usage on the plateform after 2015. The current usage metrics is available 48-96 hours after online publication and is updated daily on week days.
Initial download of the metrics may take a while.