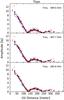
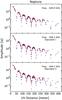
Fig. 16
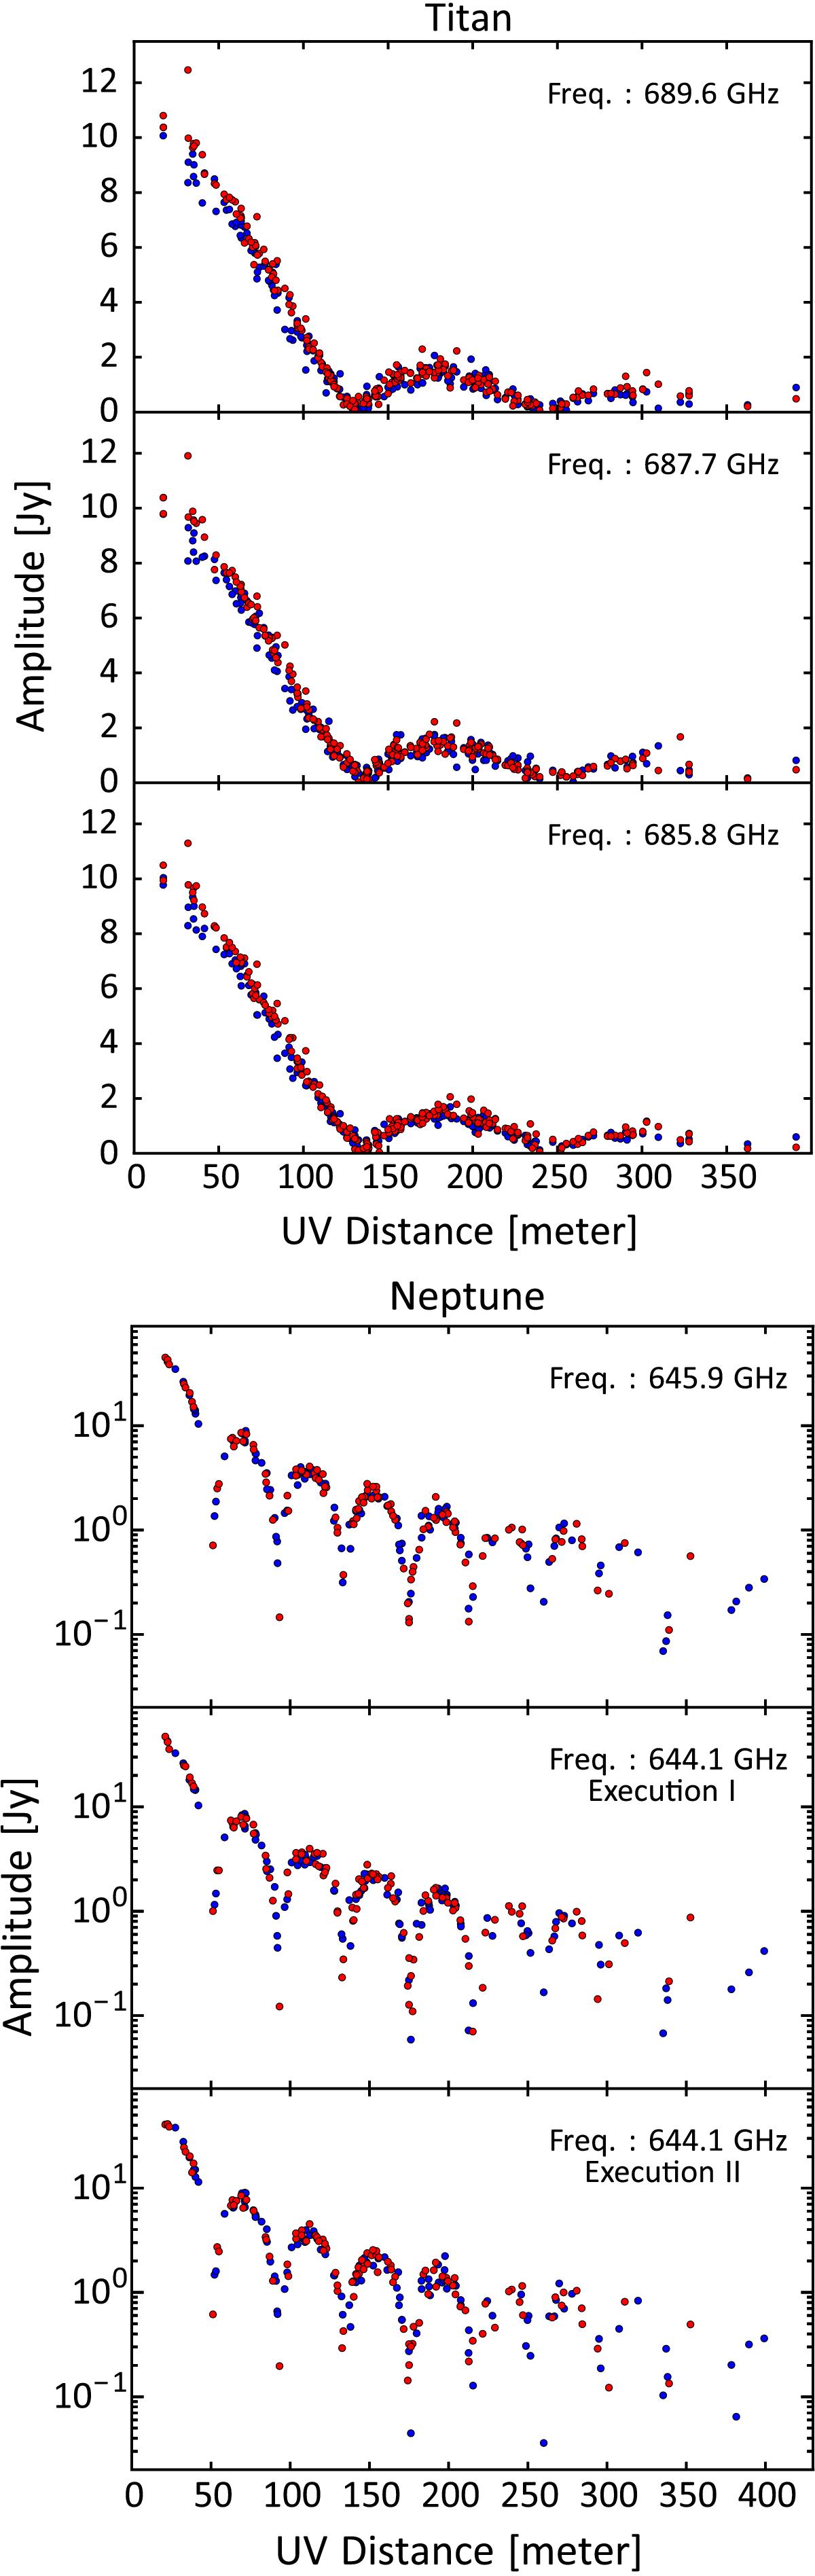
Amplitudes of a sample of flux calibrators (top: Titan, bottom: Neptune) as a function of UV-distance. In each case, three spectral windows are shown. The plots displaying Neptune data are plotted in log(Amplitude) to demonstrate the accuracy of flux calibration in resolved objects. Although the amplitudes recover the first eight nulls of the resolved Neptune emission, model fits using amplitudes up to the fifth null are very accurate. In each plot, blue and red points show the different polarizations.
Current usage metrics show cumulative count of Article Views (full-text article views including HTML views, PDF and ePub downloads, according to the available data) and Abstracts Views on Vision4Press platform.
Data correspond to usage on the plateform after 2015. The current usage metrics is available 48-96 hours after online publication and is updated daily on week days.
Initial download of the metrics may take a while.