Fig. 2
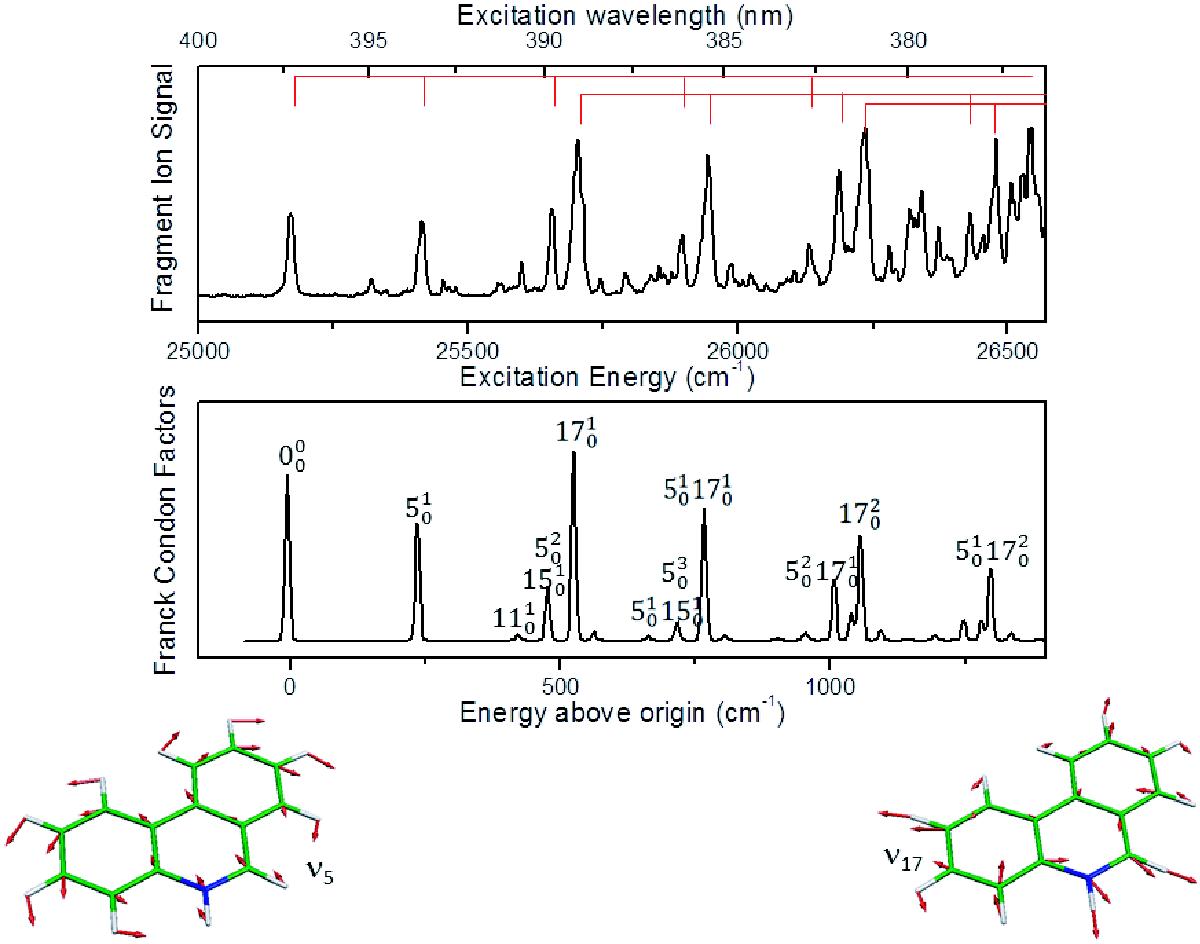
Photofragmentation spectrum of protonated phenanthridine compared to the simulated spectrum: a) the experimental spectrum plotted as the fragment ion signal (arbitrary units) as a function of the excitation energy; b) the simulated spectrum plotted as the Franck-Condon factors as a function of the excitation energy, calculated using the calculated ground and excited state frequencies. The main vibrational progressions (indicated in red in panel a)) ν5 and ν17, are illustrated schematically below the simulated spectrum.
Current usage metrics show cumulative count of Article Views (full-text article views including HTML views, PDF and ePub downloads, according to the available data) and Abstracts Views on Vision4Press platform.
Data correspond to usage on the plateform after 2015. The current usage metrics is available 48-96 hours after online publication and is updated daily on week days.
Initial download of the metrics may take a while.