Fig. 1
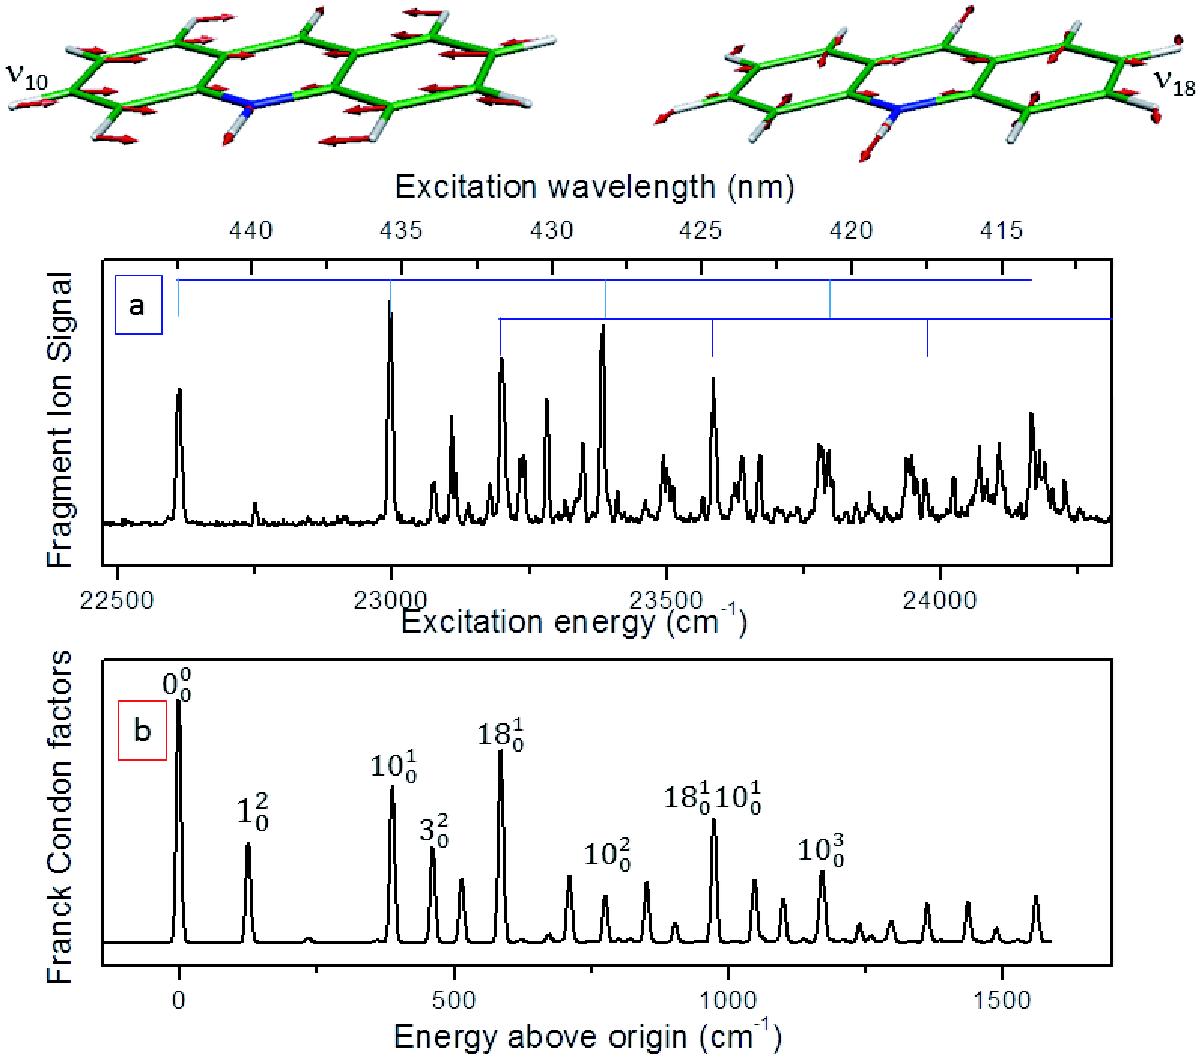
Photofragmentation spectrum of protonated acridine compared to the simulated spectrum: a) the experimental spectrum plotted as the fragment ion signal (arbitrary units) as a function of the excitation energy; b) the simulated spectrum plotted as the Franck-Condon factors as a function of the excitation energy, calculated using the calculated ground and excited state frequencies. The main vibrational progressions (indicated in blue in panel a) involve, essentially, the two symmetric modes ν10 at 383 cm-1 (ring breathing) and ν18 at 587 cm-1. These vibrational modes are illustrated schematically above the experimental spectrum, with arrows representing the direction and relative magnitude of the displacement of each atom. The intensities of the out of plane modes ν1 and ν3 are overestimated in the simulation.
Current usage metrics show cumulative count of Article Views (full-text article views including HTML views, PDF and ePub downloads, according to the available data) and Abstracts Views on Vision4Press platform.
Data correspond to usage on the plateform after 2015. The current usage metrics is available 48-96 hours after online publication and is updated daily on week days.
Initial download of the metrics may take a while.