Fig. 3
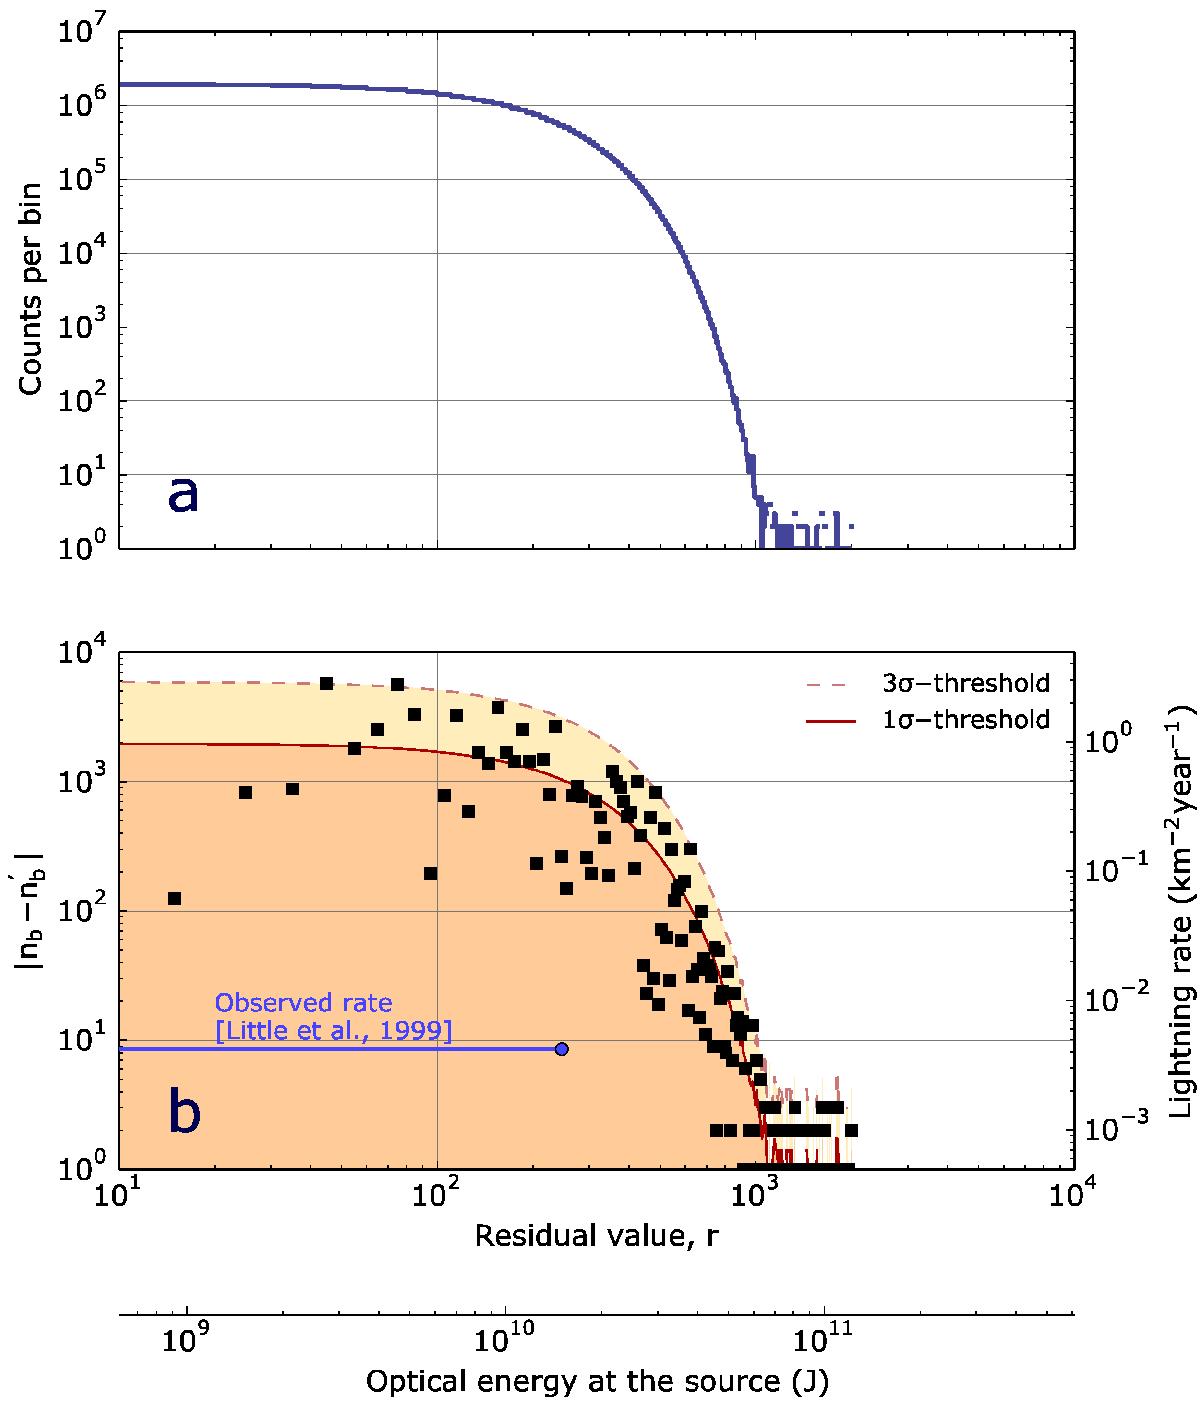
a) Histogram of the residuals r after performing a principal components analysis to remove atmospheric variations. The residuals are distributed among equally spaced bins of width w = 10. b) Difference between the counts per bin in our data, nb and in a randomly generated sample that simulates shot noise, ![]() and σ and 3σ levels required for a statistically significant detection. The right axis translates these numbers into a frequency of events in the full disk of the planet, providing a constraint on the frequency of flashes from our observations. The lower axis translates a peak pixel excess intensity into an estimate of the total optical energy of an hypothetical flash in Jupiter, accounting for the smearing due to the seeing conditions. The horizontal blue line marks the rate estimated by Little et al. (1999) and extends to the highest lightning energy observed by these authors.
and σ and 3σ levels required for a statistically significant detection. The right axis translates these numbers into a frequency of events in the full disk of the planet, providing a constraint on the frequency of flashes from our observations. The lower axis translates a peak pixel excess intensity into an estimate of the total optical energy of an hypothetical flash in Jupiter, accounting for the smearing due to the seeing conditions. The horizontal blue line marks the rate estimated by Little et al. (1999) and extends to the highest lightning energy observed by these authors.
Current usage metrics show cumulative count of Article Views (full-text article views including HTML views, PDF and ePub downloads, according to the available data) and Abstracts Views on Vision4Press platform.
Data correspond to usage on the plateform after 2015. The current usage metrics is available 48-96 hours after online publication and is updated daily on week days.
Initial download of the metrics may take a while.