Fig. 5
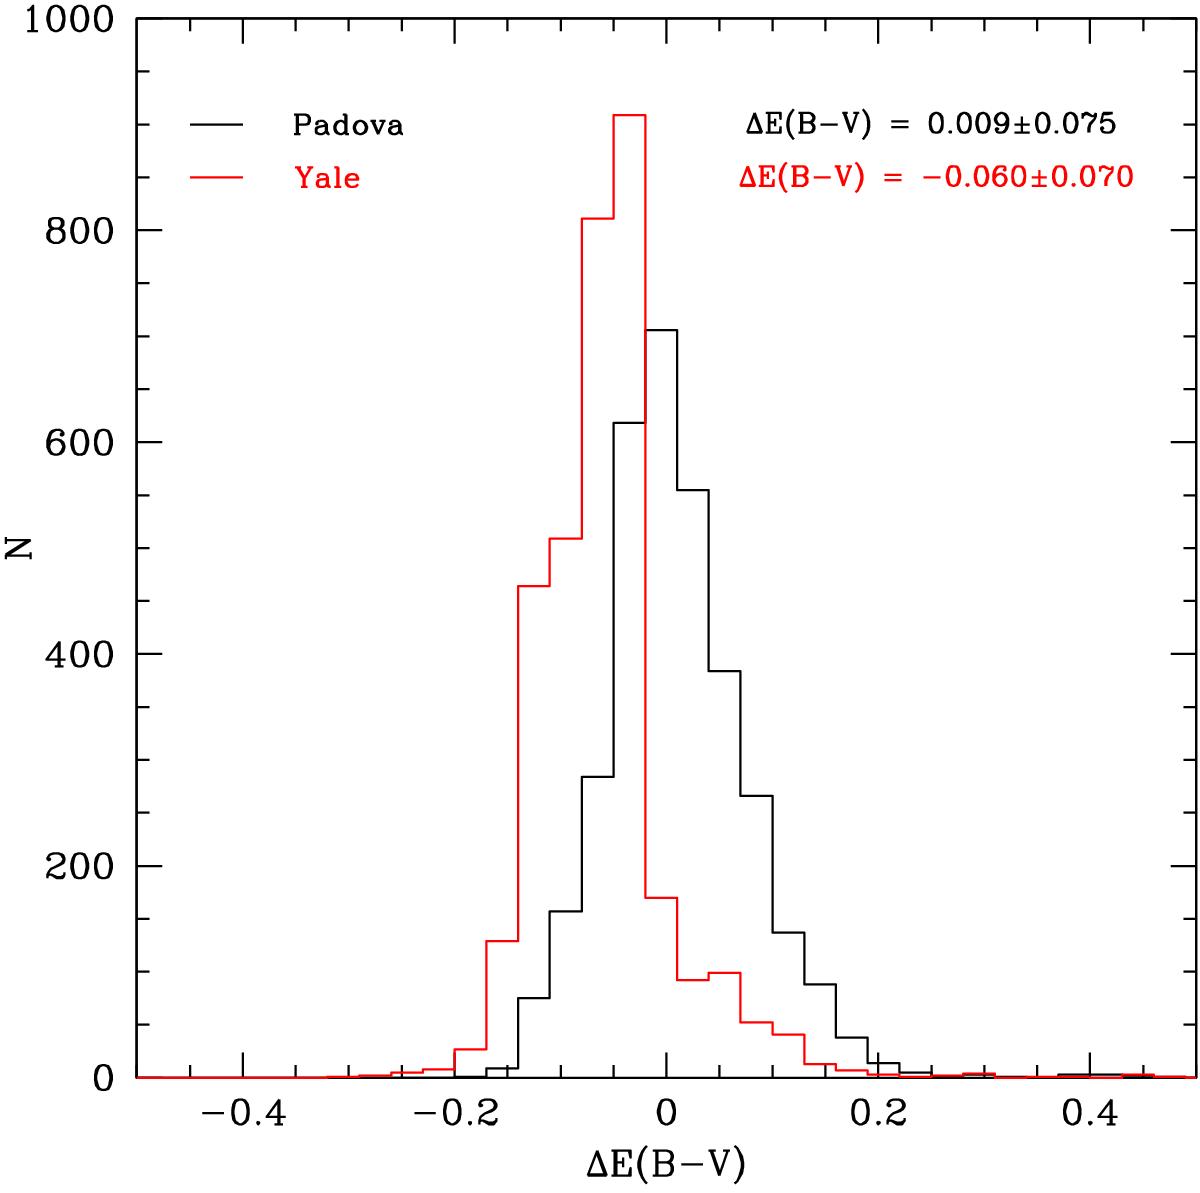
Histogram of the differences between our derived E(B − V) and the value of Schlegel SFD98 for high Galactic latitude stars (|b| > 10°). The black lines plot the derived extinction values using the Padova isochrones, the red lines those from the Yale isochrones. The mean value and the rms scatter is indicated in the top left corner.
Current usage metrics show cumulative count of Article Views (full-text article views including HTML views, PDF and ePub downloads, according to the available data) and Abstracts Views on Vision4Press platform.
Data correspond to usage on the plateform after 2015. The current usage metrics is available 48-96 hours after online publication and is updated daily on week days.
Initial download of the metrics may take a while.