Fig. 3
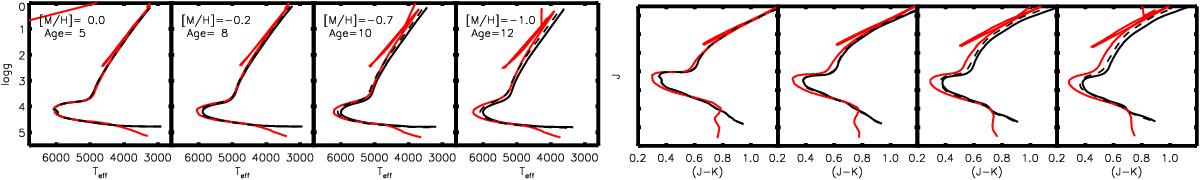
Left: isochrones in the Teff vs. log g space for different combinations of [M/H] and ages. The red line shows the Padova isochrones. The dashed black line indicates the Yonsei-Yale isochrones without α-elements, while the plain black line plots YY models with alpha enhancement. Right: similar as in the left panel, but in the J − K vs. K colour−magnitude diagram.
Current usage metrics show cumulative count of Article Views (full-text article views including HTML views, PDF and ePub downloads, according to the available data) and Abstracts Views on Vision4Press platform.
Data correspond to usage on the plateform after 2015. The current usage metrics is available 48-96 hours after online publication and is updated daily on week days.
Initial download of the metrics may take a while.