Fig. 2
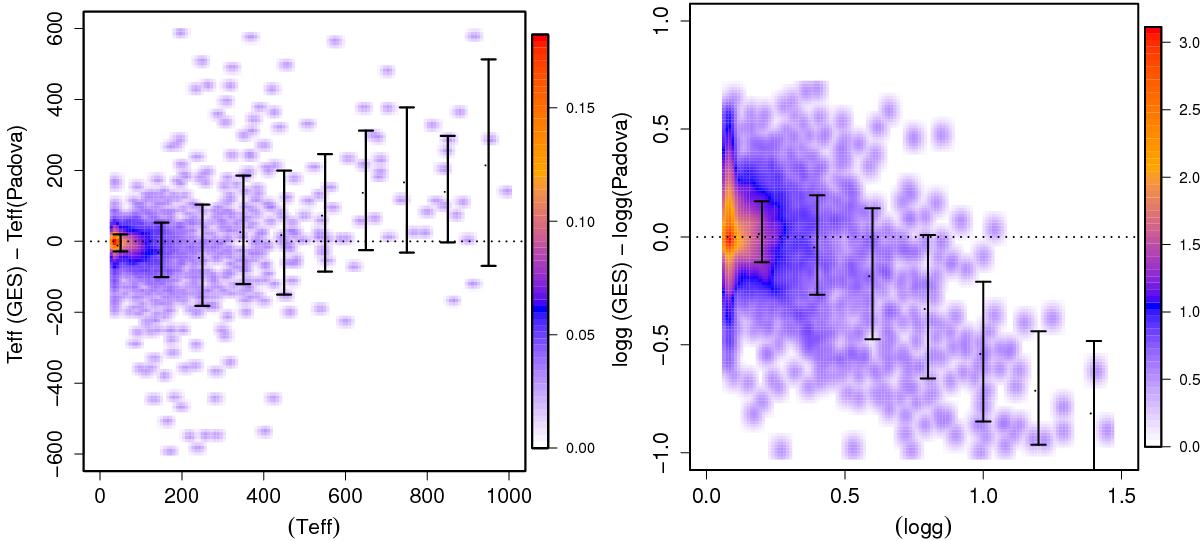
Left: density plot of the difference between Teff and the corresponding temperature from the isochrones and the dispersion of Teff between the three nodes (see text). The black points indicate the mean (in 100 K steps) and the error bars the standard deviations. Right: same, but for log g. The black points indicate the mean (in 0.2 dex steps) and the error-bars the standard deviations.
Current usage metrics show cumulative count of Article Views (full-text article views including HTML views, PDF and ePub downloads, according to the available data) and Abstracts Views on Vision4Press platform.
Data correspond to usage on the plateform after 2015. The current usage metrics is available 48-96 hours after online publication and is updated daily on week days.
Initial download of the metrics may take a while.