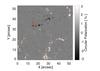
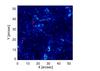
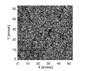
Fig. 1

Example of the data analysed in this study. Top: photospheric circular polarization map saturated between −3% and 3%. Centre: chromospheric broadband image of the same region. The 35 longest-lived magnetic elements used in the analysis are highlighted with yellow circles. The red crosses mark the six elements whose power spectra are shown in Fig. 3 (see text for more details). Bottom: continuum image taken at 395.3 nm with 1 Å bandpass.
Current usage metrics show cumulative count of Article Views (full-text article views including HTML views, PDF and ePub downloads, according to the available data) and Abstracts Views on Vision4Press platform.
Data correspond to usage on the plateform after 2015. The current usage metrics is available 48-96 hours after online publication and is updated daily on week days.
Initial download of the metrics may take a while.