Fig. 8
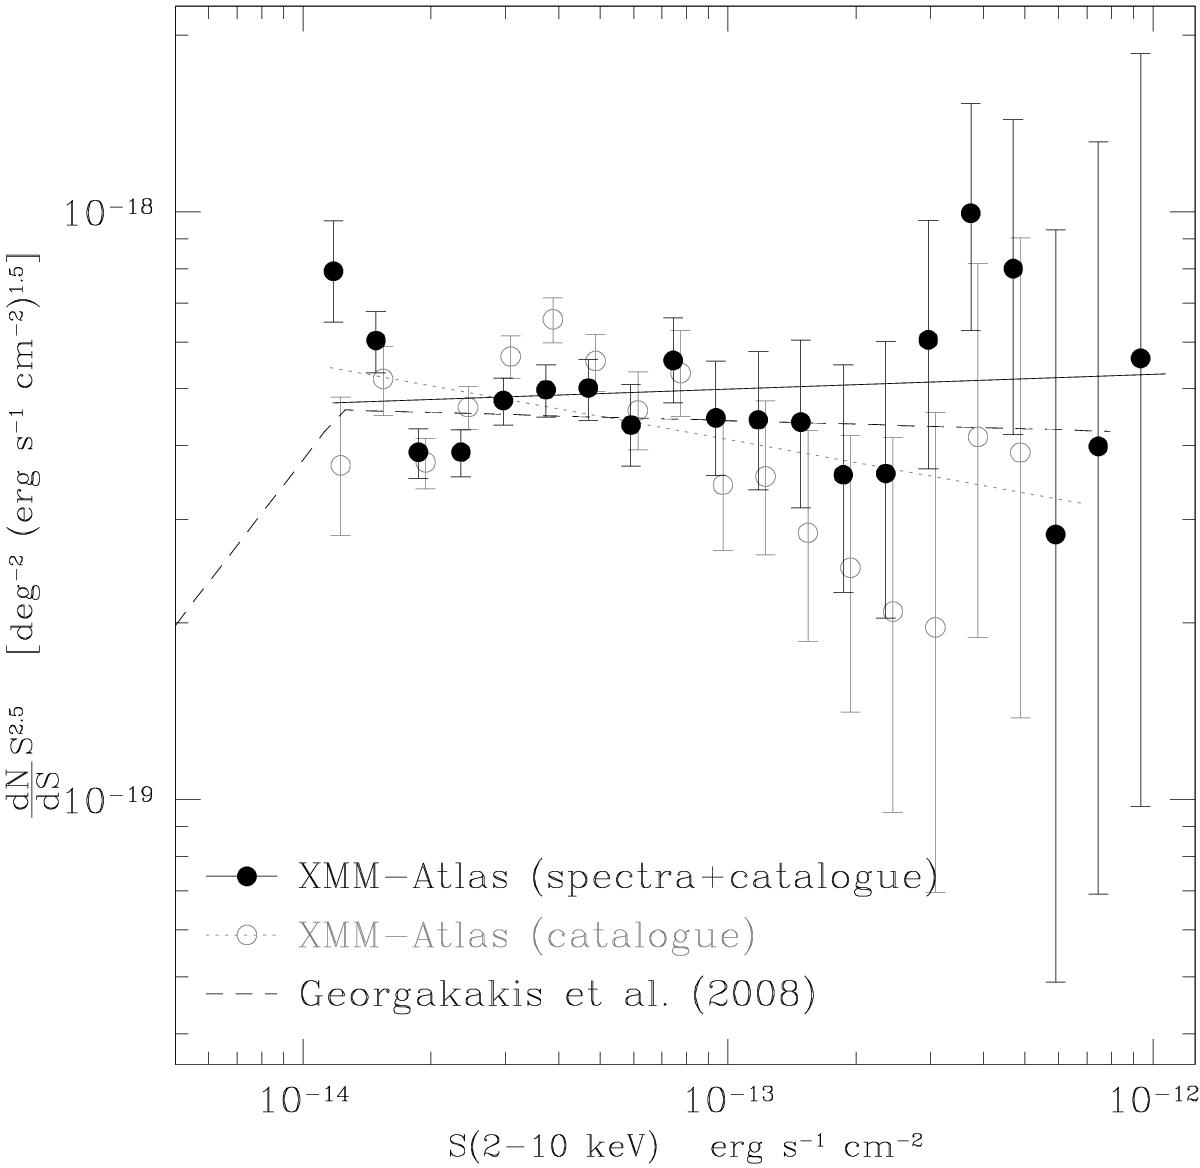
XMM-ATLAS log N–log S in the 2–10 keV band. Filled circles: fluxes from the spectral fits are used whenever possible; catalogue fluxes are used otherwise. Open circles: only fluxes from the catalogue are used; a small horizontal shift has been introduced in the plot to better distinguish the error bars. The solid line shows the best fit to the filled data points. The dashed line is the best-fit model from Georgakakis et al. (2008). The error bars show the 1σ uncertainty.
Current usage metrics show cumulative count of Article Views (full-text article views including HTML views, PDF and ePub downloads, according to the available data) and Abstracts Views on Vision4Press platform.
Data correspond to usage on the plateform after 2015. The current usage metrics is available 48-96 hours after online publication and is updated daily on week days.
Initial download of the metrics may take a while.