Fig. 3
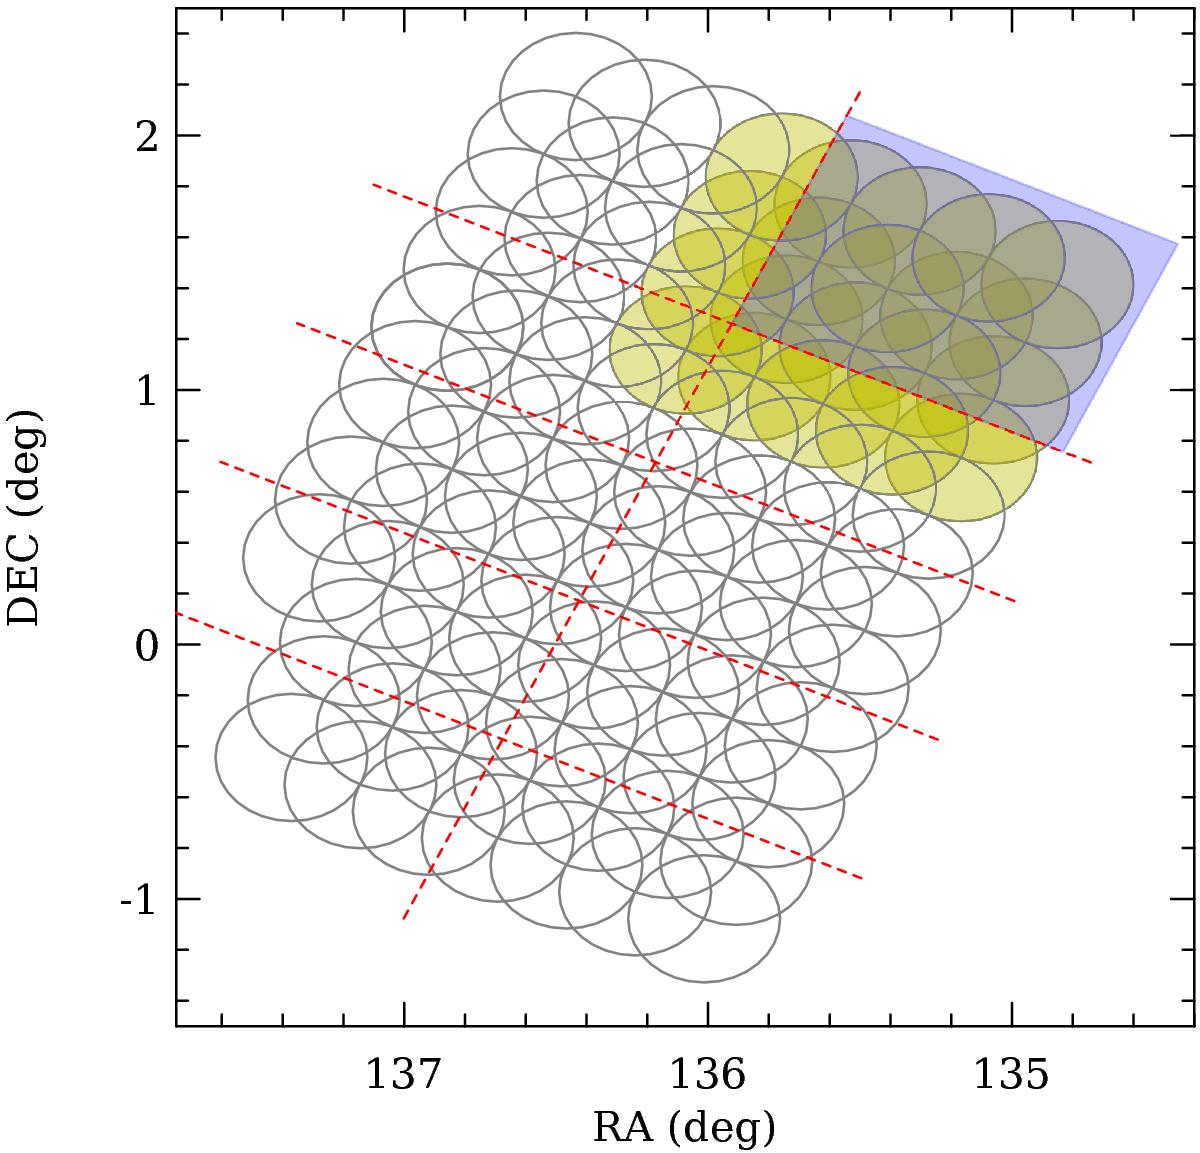
Detection grid for EMLDetect. The grey circles have a radius of 15′ and show the FOV of the individual pointings. The dashed red lines show the grid. The cyan rectangle highlights one of the detection cells. The filled yellow circles are the pointings that intersect the cell and are used for the detection. Only the sources whose coordinates fall into the cell (the rectangle) are kept. This process is repeated for all cells and the final catalogue is the union of the sources from all cells.
Current usage metrics show cumulative count of Article Views (full-text article views including HTML views, PDF and ePub downloads, according to the available data) and Abstracts Views on Vision4Press platform.
Data correspond to usage on the plateform after 2015. The current usage metrics is available 48-96 hours after online publication and is updated daily on week days.
Initial download of the metrics may take a while.