Fig. 2
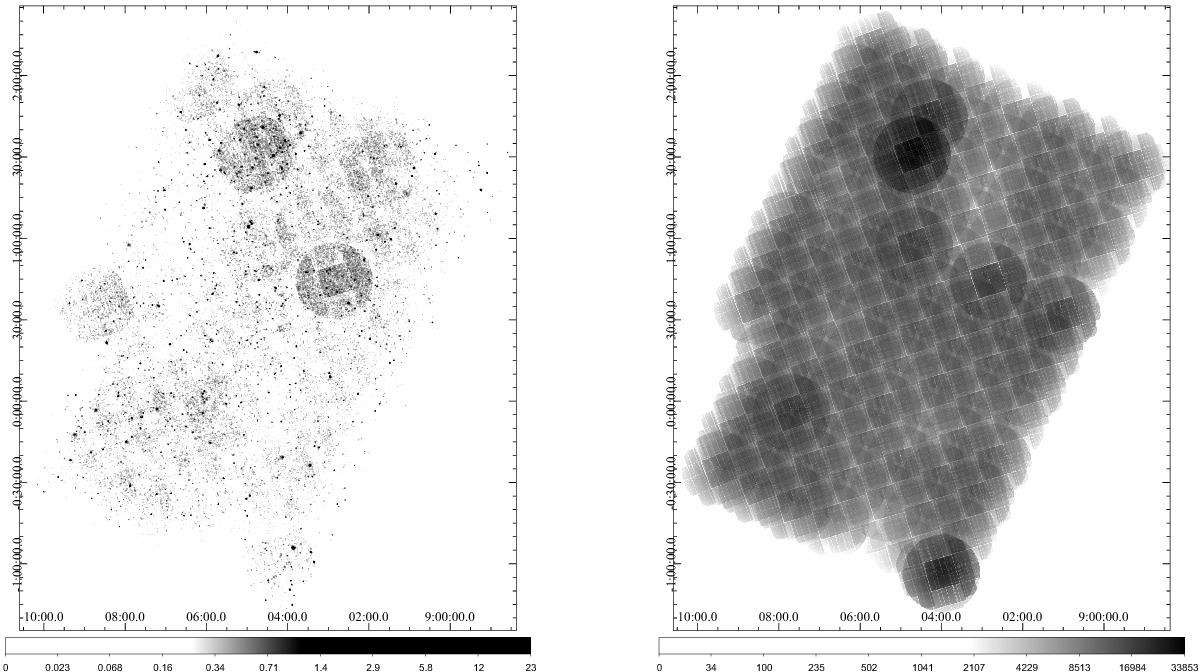
Left: image of the entire mosaic of the XMM-ATLAS observations in the 0.5−8 keV band. The greyscale wedge shows the photon counts (truncated; the actual maximum is 117 counts). A Gaussian smoothing with 20″ radius was applied to enhance the sources. Some areas with longer exposure times and/or higher background are visible. Right: exposure map in the 0.5−8 keV band. The greyscale wedge (maximum value: 33.9 ks) shows the sum of the MOS1, MOS2 and PN exposure times in s, corrected for vignetting and bad pixels.
Current usage metrics show cumulative count of Article Views (full-text article views including HTML views, PDF and ePub downloads, according to the available data) and Abstracts Views on Vision4Press platform.
Data correspond to usage on the plateform after 2015. The current usage metrics is available 48-96 hours after online publication and is updated daily on week days.
Initial download of the metrics may take a while.