Free Access
Fig. 1
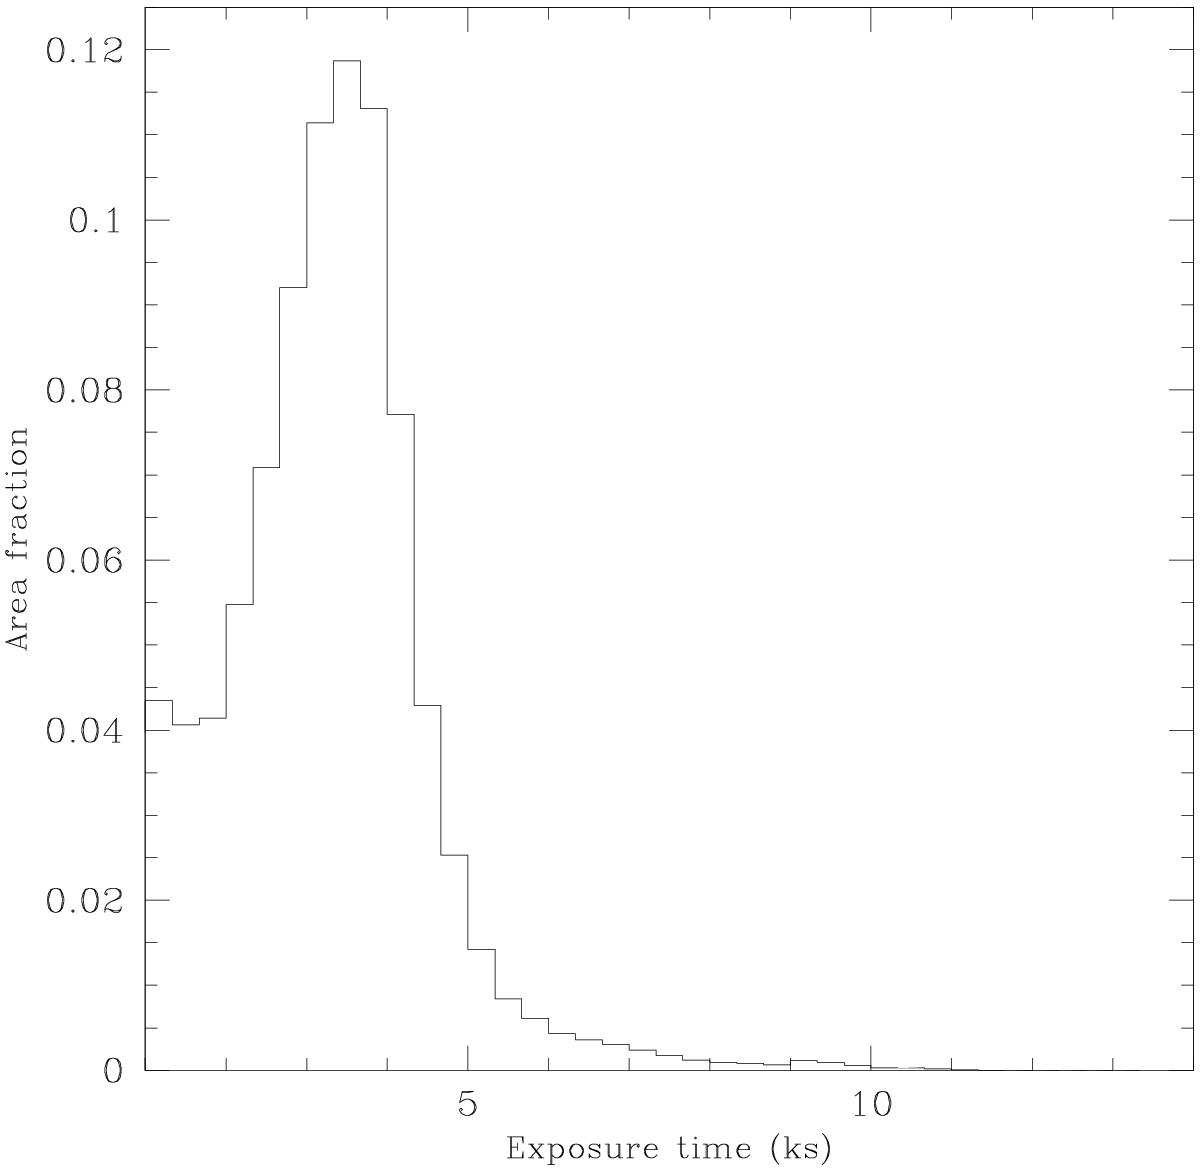
Distribution of the exposure times in the XMM-ATLAS mosaic (bin size: 1 ks). The times are the average between MOS1, MOS2, and PN, for the 0.5−8 keV band; the vertical axis shows the fraction of pixels with a given exposure.
Current usage metrics show cumulative count of Article Views (full-text article views including HTML views, PDF and ePub downloads, according to the available data) and Abstracts Views on Vision4Press platform.
Data correspond to usage on the plateform after 2015. The current usage metrics is available 48-96 hours after online publication and is updated daily on week days.
Initial download of the metrics may take a while.