Free Access
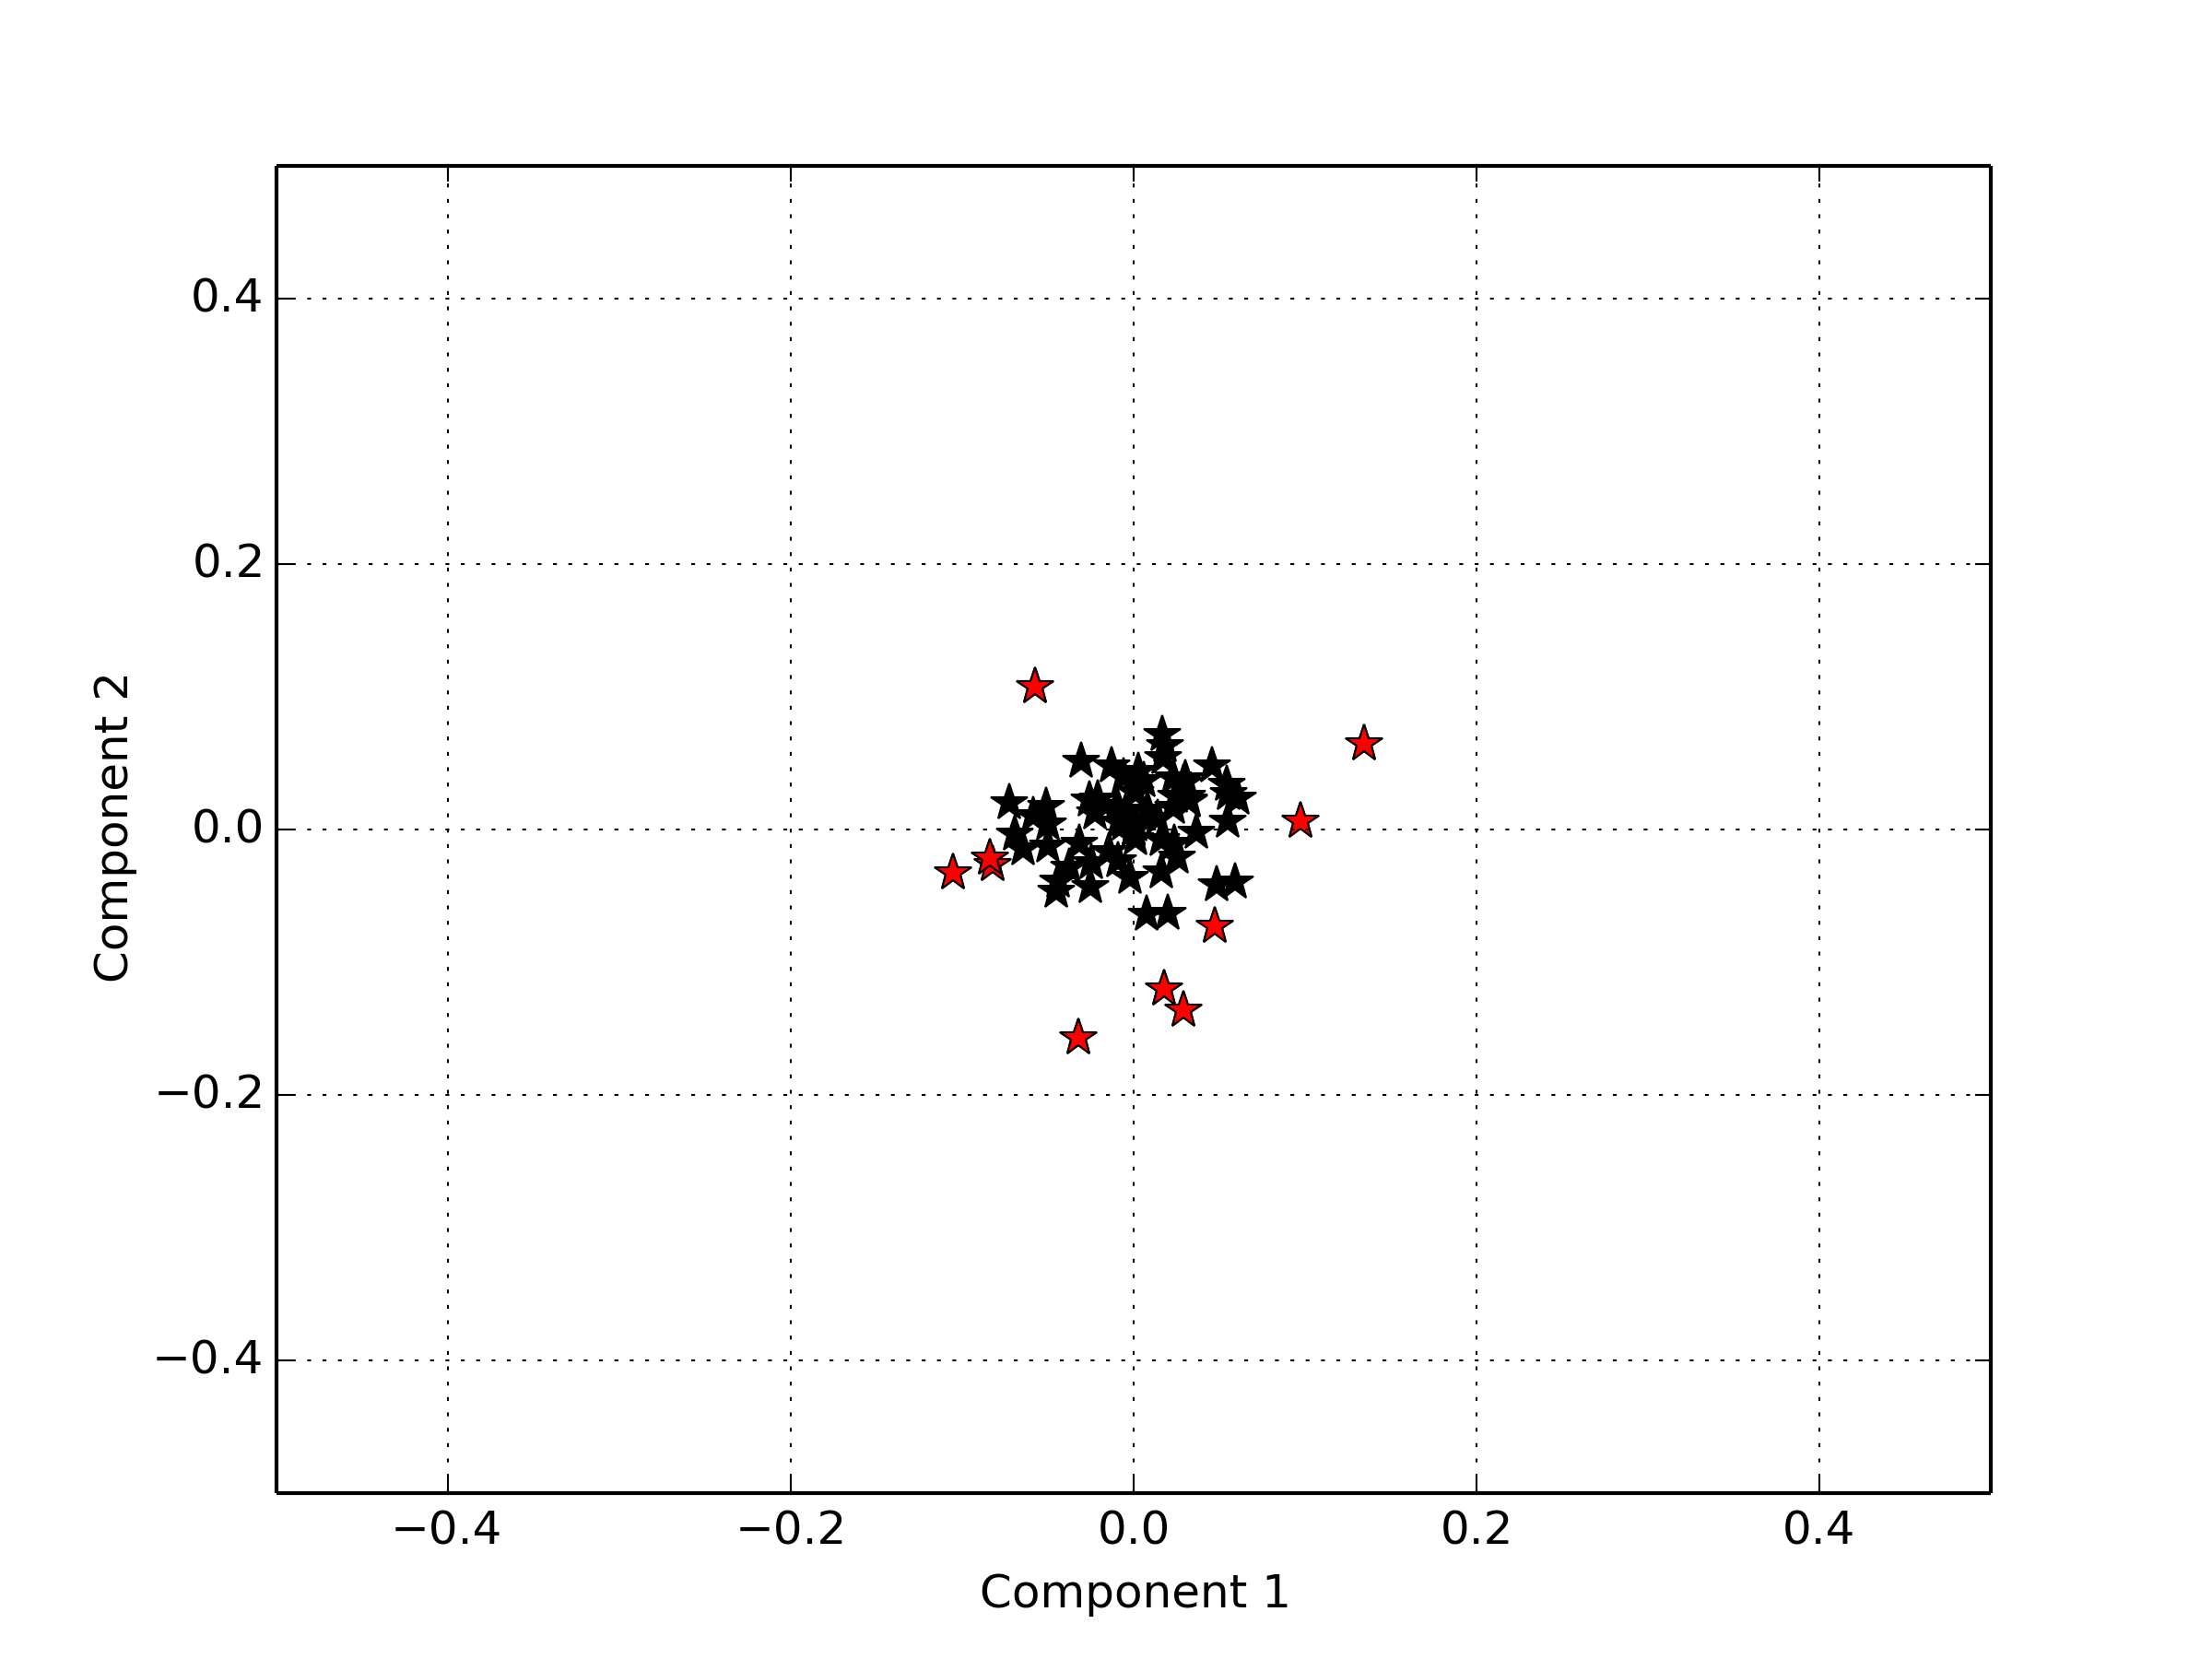
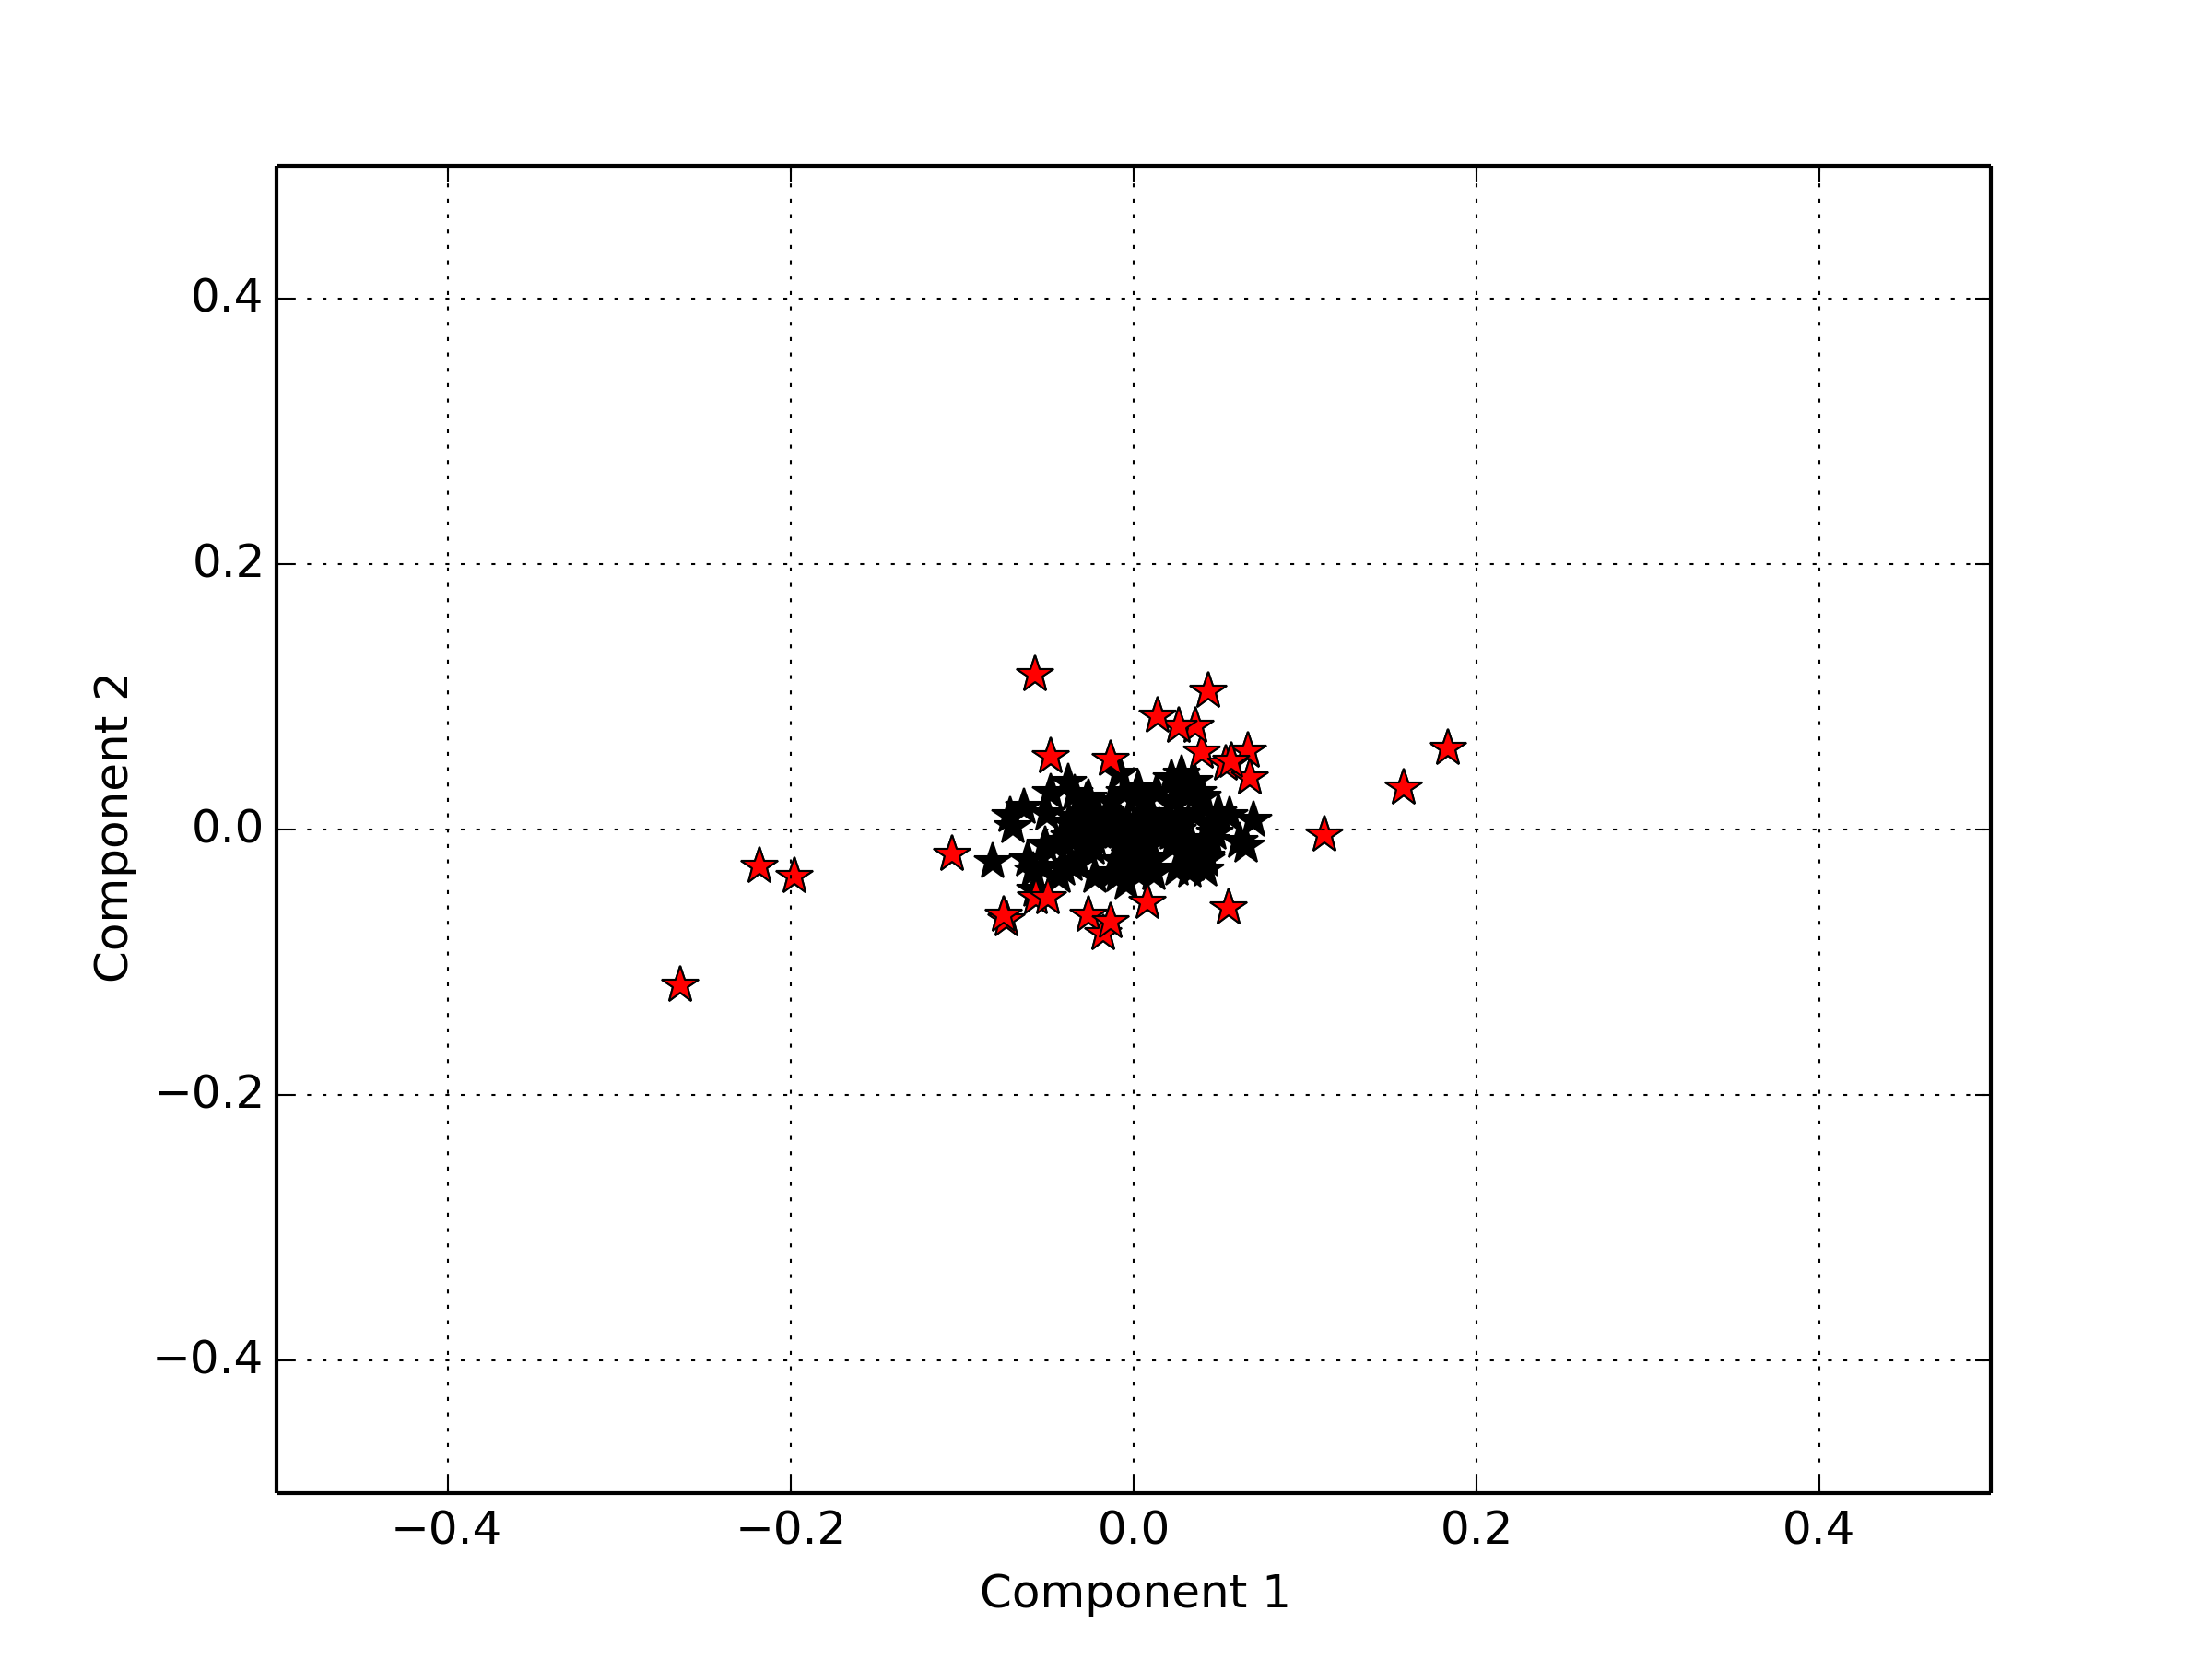
Fig. 1
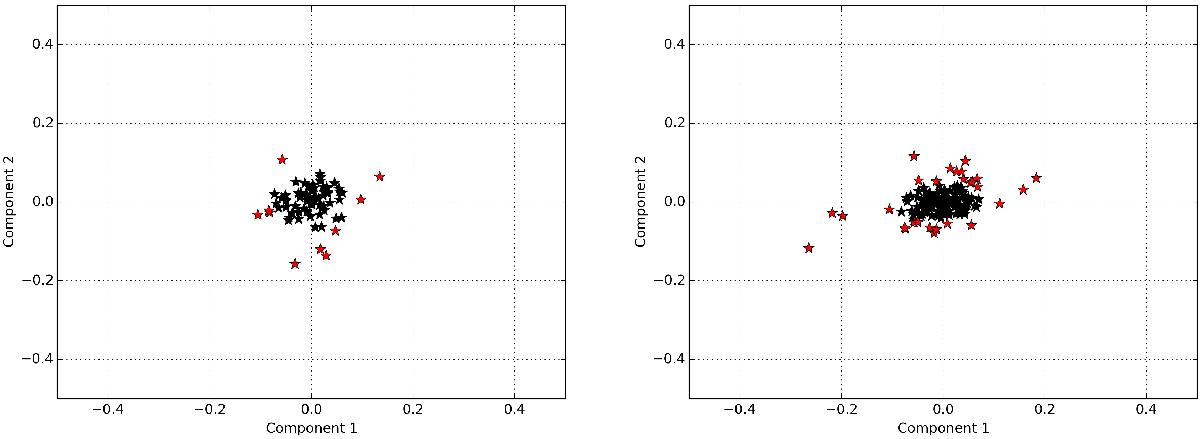
Dwarf (left) and giant stars (right) from all clusters represented using the first two components of the PCA with the central cluster location subtracted. Stars chemically identified as outliers are shown in red.
This figure is made of several images, please see below:
Current usage metrics show cumulative count of Article Views (full-text article views including HTML views, PDF and ePub downloads, according to the available data) and Abstracts Views on Vision4Press platform.
Data correspond to usage on the plateform after 2015. The current usage metrics is available 48-96 hours after online publication and is updated daily on week days.
Initial download of the metrics may take a while.