Fig. 9
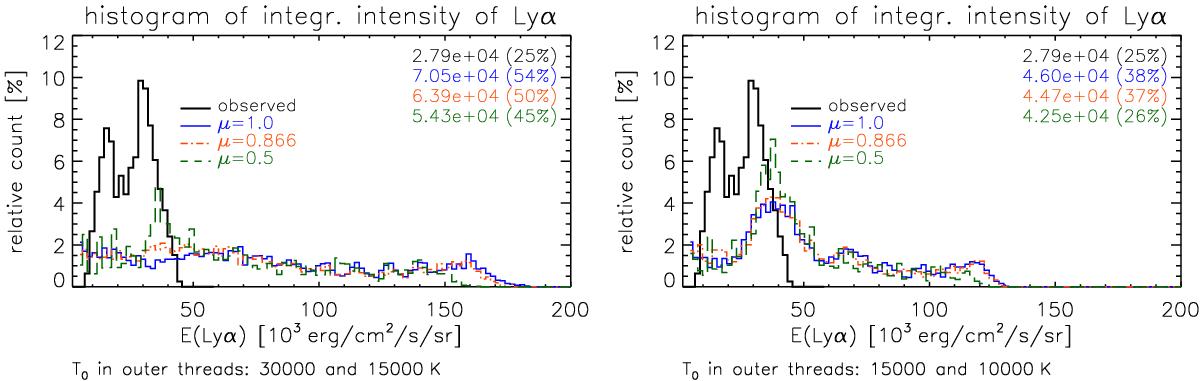
Compared histograms of the Lyα integrated intensity of the observed profiles with those calculated using multi-thread models with hotter outer threads. Left panel: multi-thread models with T0 values of 30 000 and 15 000 K in the outer threads. Right panel: comparison for somewhat lower temperatures of 15 000 and 10 000 K. The solid black line represents the observed data. Three values of μ are represented with corresponding colours and line-styles.
Current usage metrics show cumulative count of Article Views (full-text article views including HTML views, PDF and ePub downloads, according to the available data) and Abstracts Views on Vision4Press platform.
Data correspond to usage on the plateform after 2015. The current usage metrics is available 48-96 hours after online publication and is updated daily on week days.
Initial download of the metrics may take a while.