Fig. 5
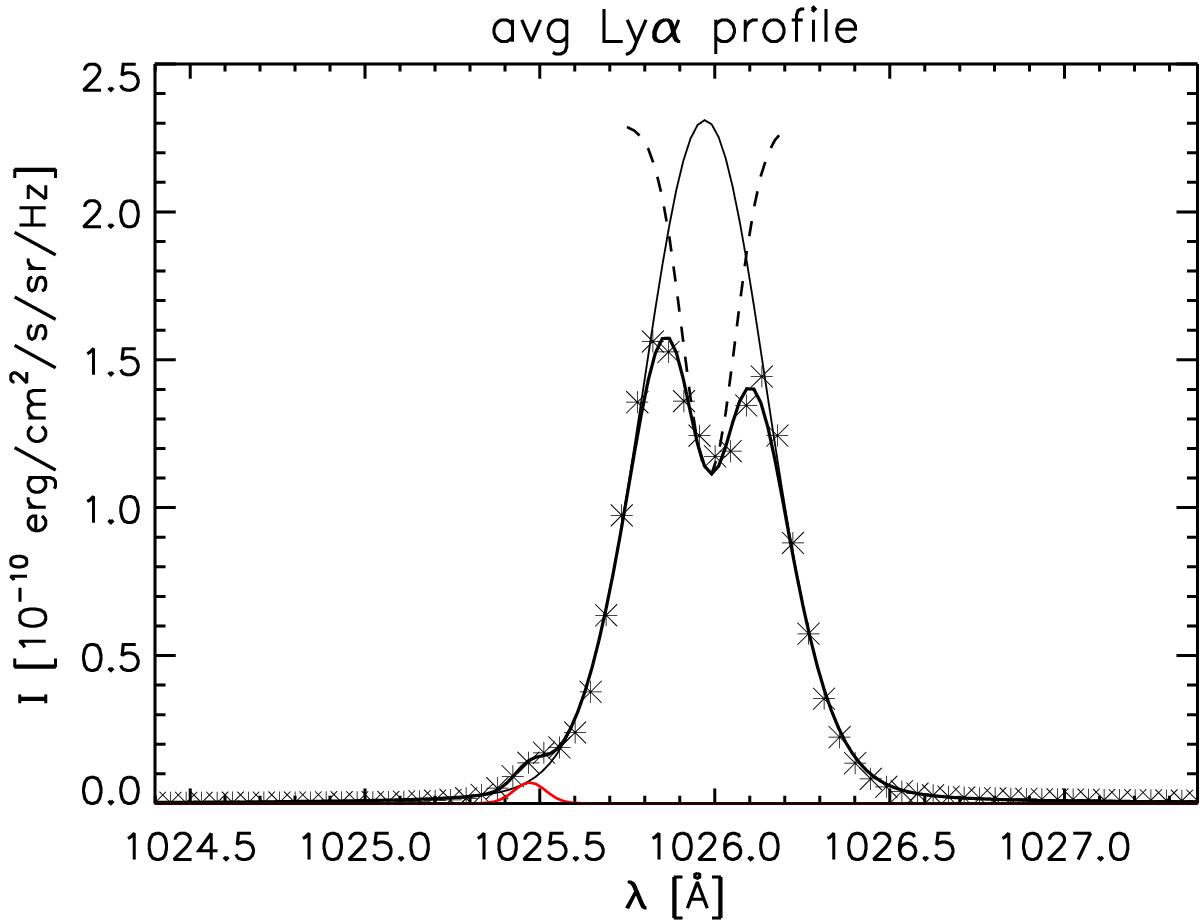
Example of fitting of a Lyα profile to estimate the influence of a blend on the three profile characteristics. Observed data are plotted with stars, while the resulting fitted profile (including blends) is plotted as a thick full line. The Voigt function fitting the profile in the wings is plotted as a thin solid line and the negative Gaussian in the profile reversal as a dashed line. The blend occurring at approximately 1025.5 Å was fitted with the Gaussian and is plotted in red.
Current usage metrics show cumulative count of Article Views (full-text article views including HTML views, PDF and ePub downloads, according to the available data) and Abstracts Views on Vision4Press platform.
Data correspond to usage on the plateform after 2015. The current usage metrics is available 48-96 hours after online publication and is updated daily on week days.
Initial download of the metrics may take a while.