Fig. 9
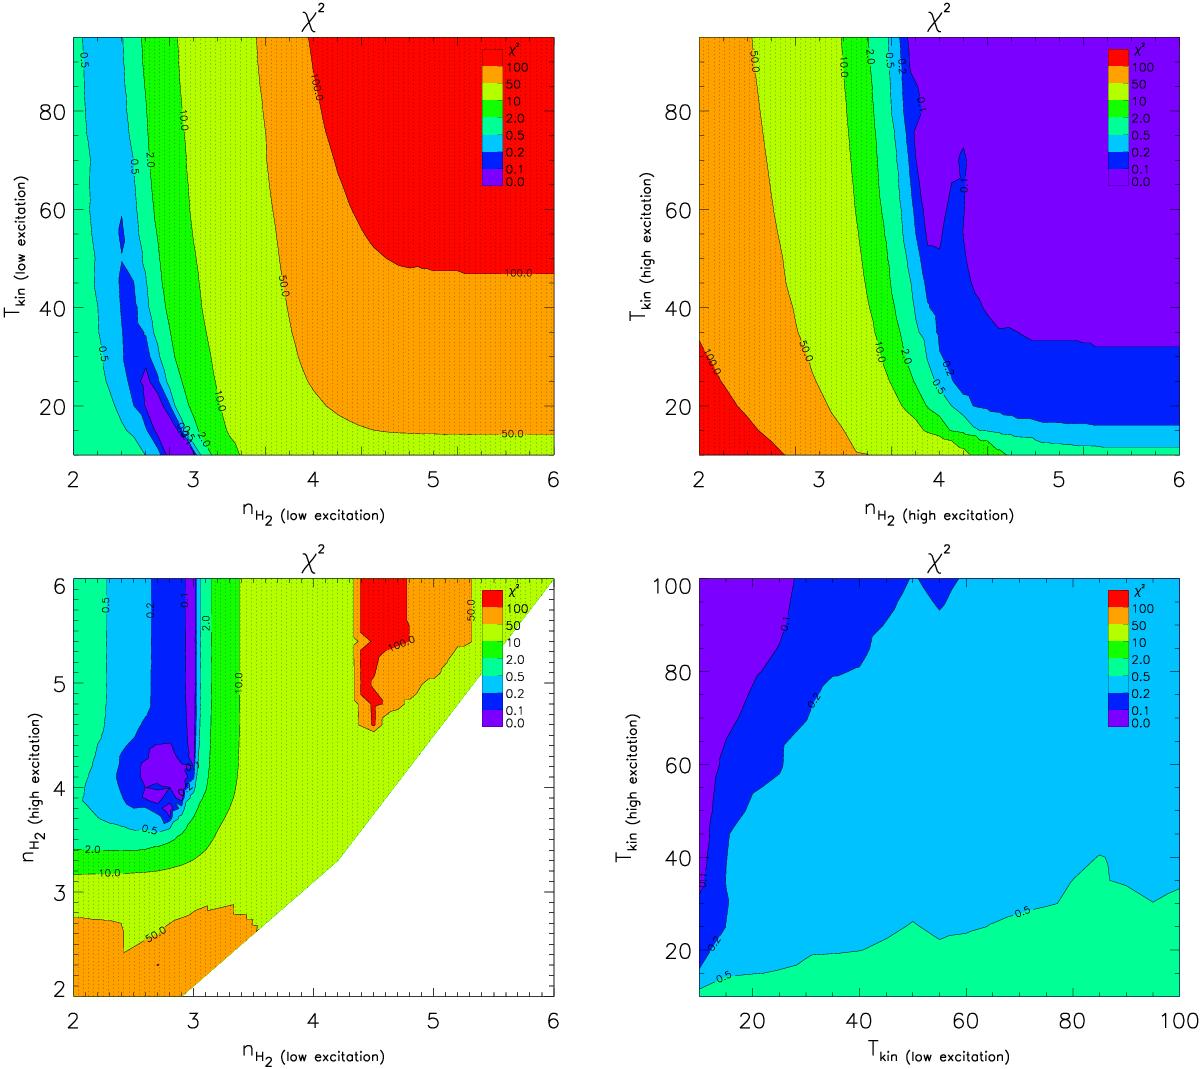
Total χ2 maps versus temperature and density for the fit of the BzK average CO SLED with two components (a low-excitation and a high-excitation component, the latter defined to peak at higher J). The color scale reflects the χ2 level: blue and light green regions correspond to acceptable fits. For a choice of variables in each panel, the minimum χ2 is computed by marginalizing over the other two free parameters.
Current usage metrics show cumulative count of Article Views (full-text article views including HTML views, PDF and ePub downloads, according to the available data) and Abstracts Views on Vision4Press platform.
Data correspond to usage on the plateform after 2015. The current usage metrics is available 48-96 hours after online publication and is updated daily on week days.
Initial download of the metrics may take a while.