Fig. 7
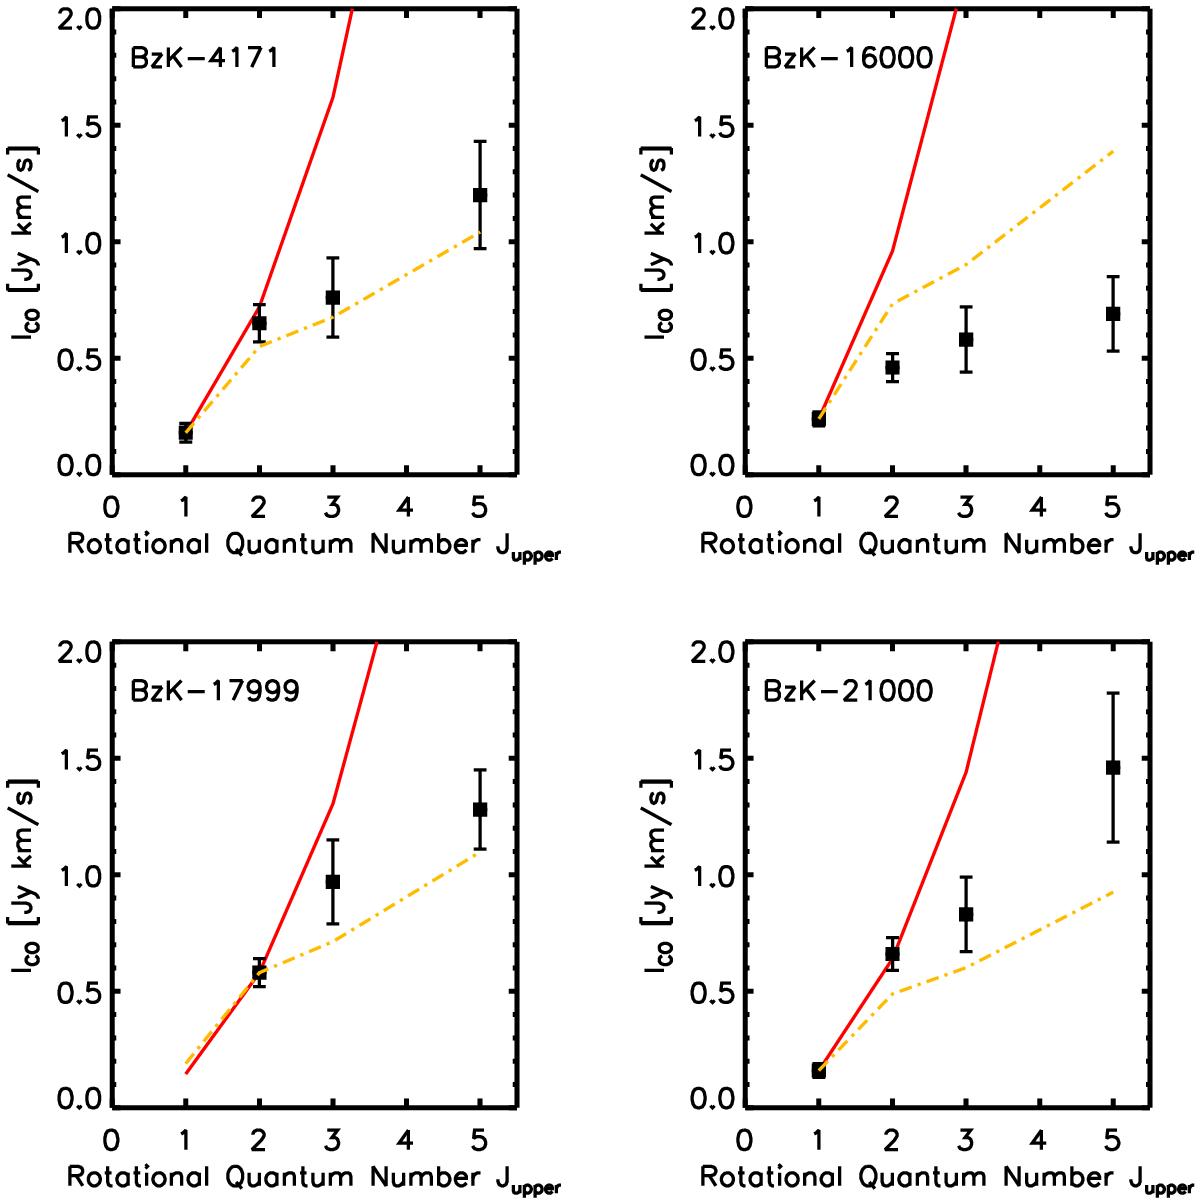
CO SLEDs for the four BzK galaxies in our sample, including IRAM PdBI data over CO[2–1], CO[3–2], and CO[5–4], and VLA measurements of CO[1–0] for three galaxies, based on Aravena et al. (2014). The dotted-dashed line shows the average SED for comparison, emphasizing excitation variations within our sample. The solid line corresponds to a constant brightness temperature.
Current usage metrics show cumulative count of Article Views (full-text article views including HTML views, PDF and ePub downloads, according to the available data) and Abstracts Views on Vision4Press platform.
Data correspond to usage on the plateform after 2015. The current usage metrics is available 48-96 hours after online publication and is updated daily on week days.
Initial download of the metrics may take a while.