Fig. 5
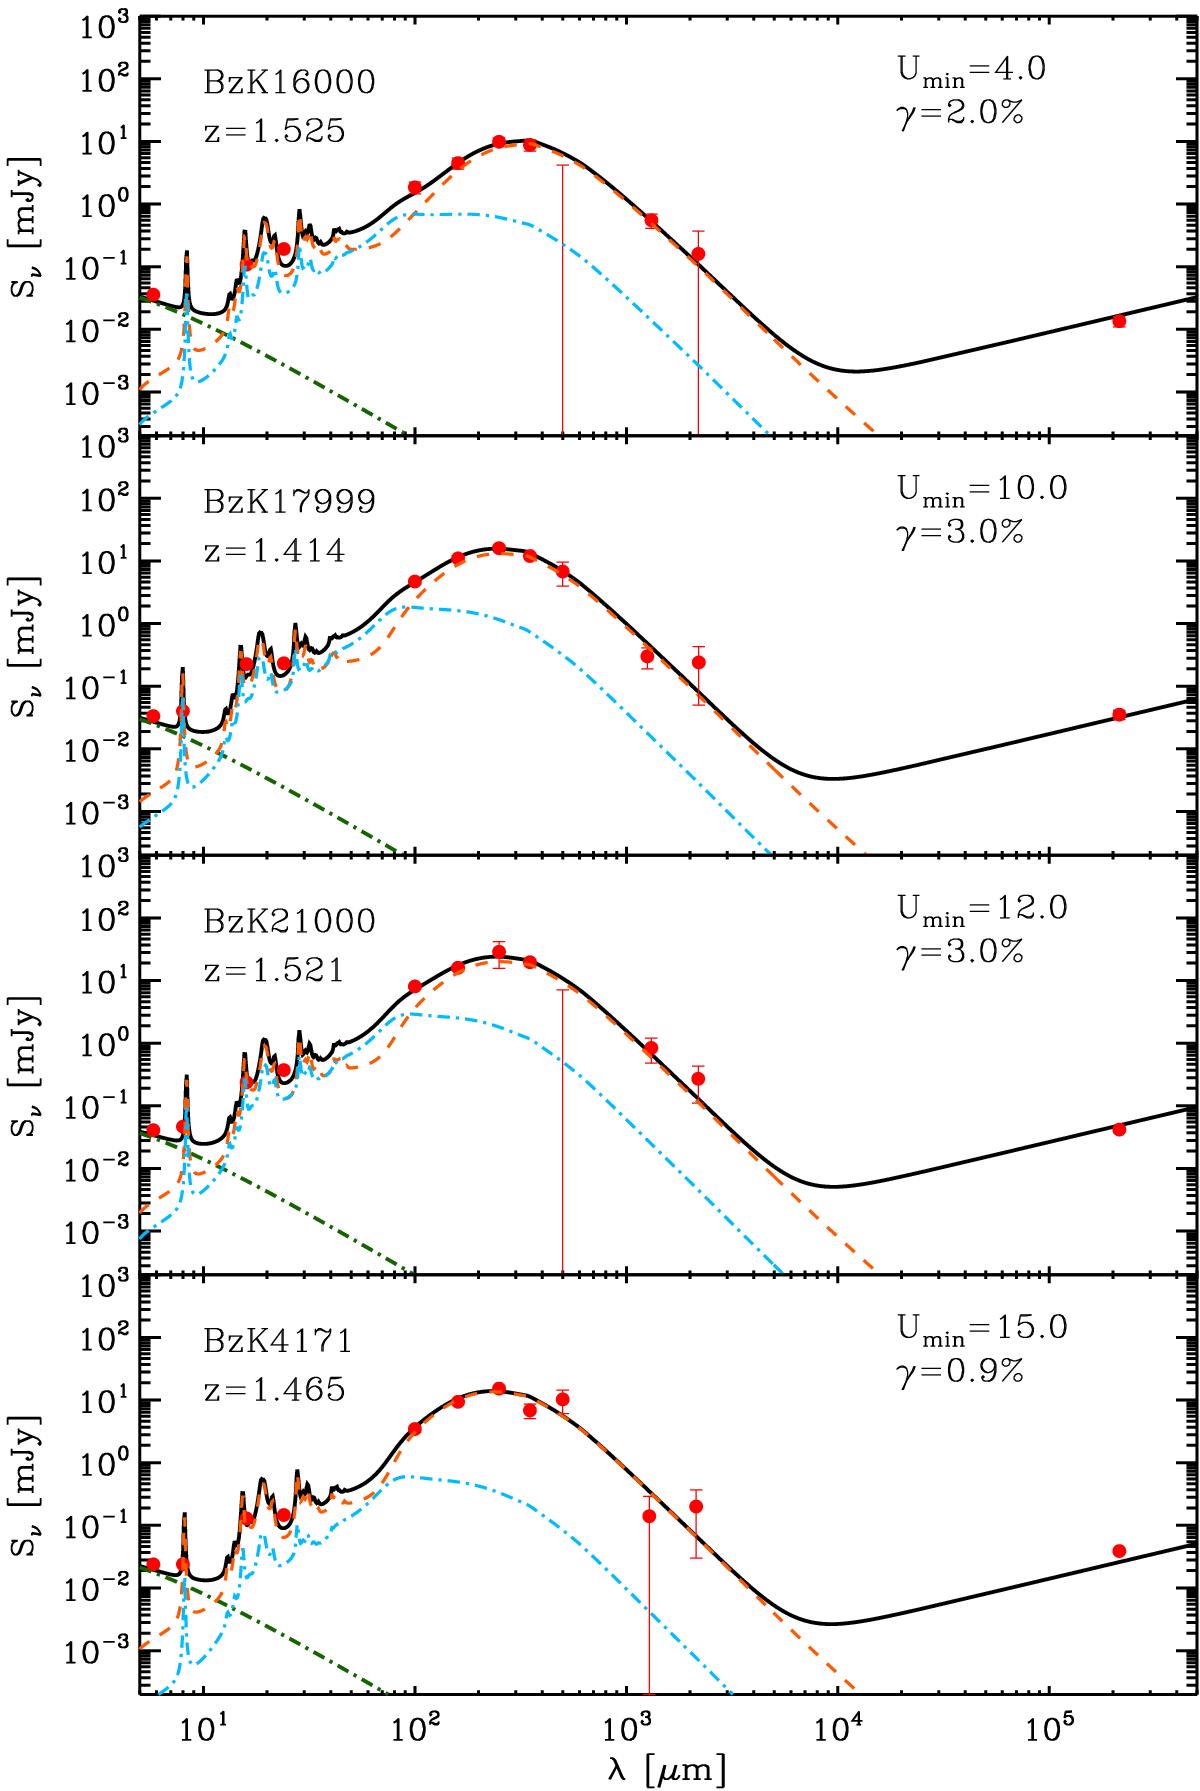
IR SEDs of our sources, fitted with the models of Draine & Li (2007), extended in the radio assuming the local radio-IR correlation. Observed wavelengths are plotted. Orange dashed and cyan dotted-dashed lines show separate contributions of starlight and emission from the diffuse ISM component and the PDR component, respectively. The stellar component is shown with a green dotted-dashed line.
Current usage metrics show cumulative count of Article Views (full-text article views including HTML views, PDF and ePub downloads, according to the available data) and Abstracts Views on Vision4Press platform.
Data correspond to usage on the plateform after 2015. The current usage metrics is available 48-96 hours after online publication and is updated daily on week days.
Initial download of the metrics may take a while.