Free Access
Fig. 3
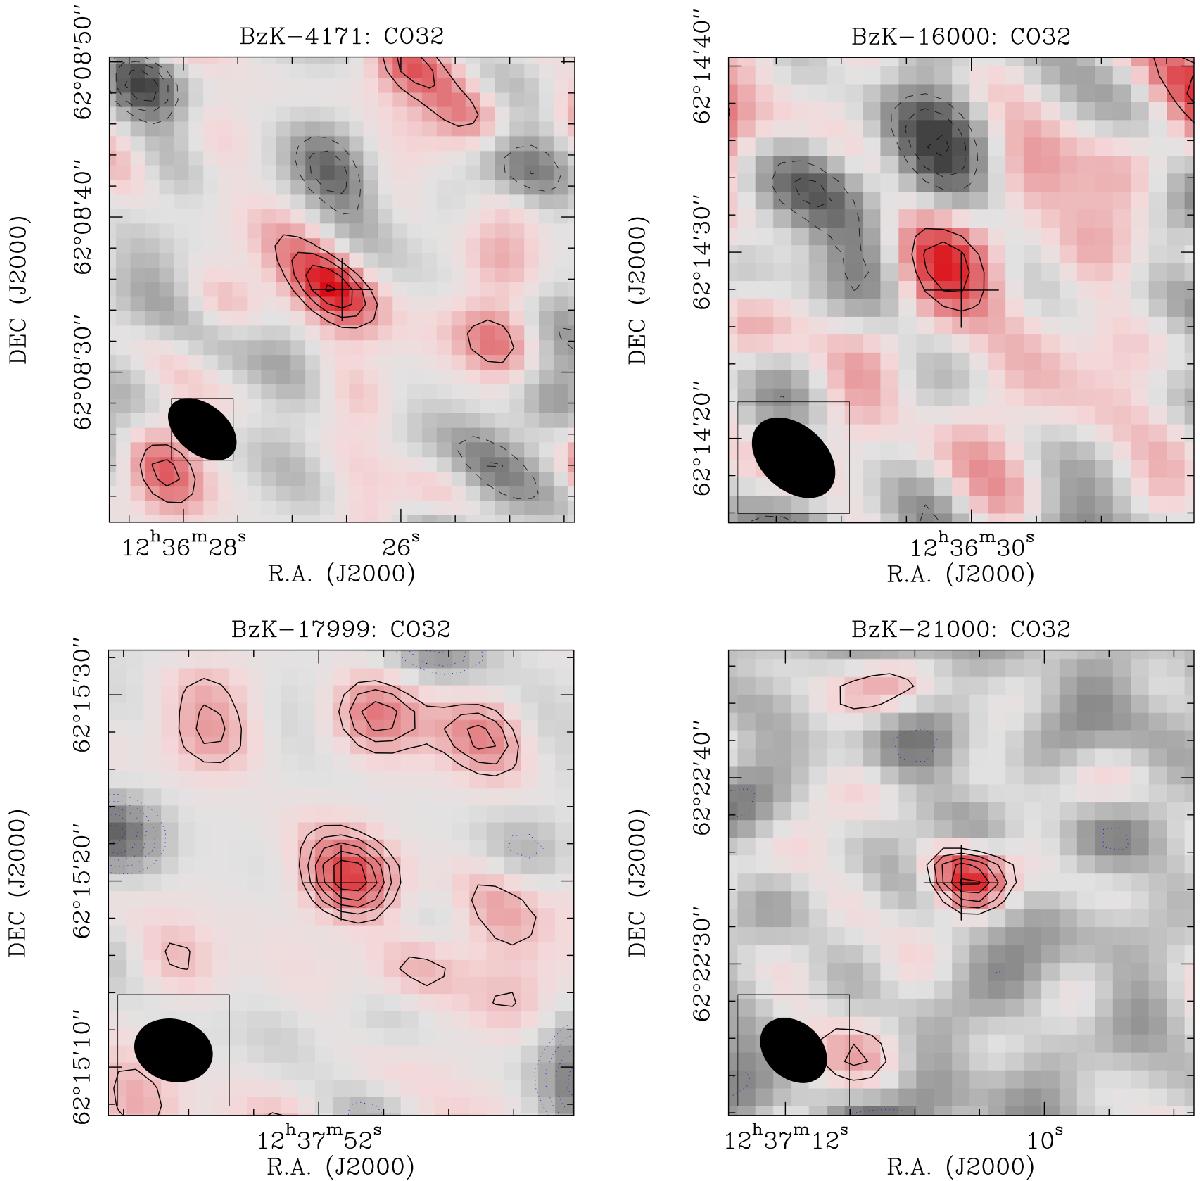
Velocity-averaged maps of the CO[3–2] emission of our galaxies, using natural weighting. Contour levels start at ± 2σ and increase in steps of 1σ. The size and orientation of the beam is indicated in the bottom left corner. The cross in each panel is centered on the CO positions from Table 1.
Current usage metrics show cumulative count of Article Views (full-text article views including HTML views, PDF and ePub downloads, according to the available data) and Abstracts Views on Vision4Press platform.
Data correspond to usage on the plateform after 2015. The current usage metrics is available 48-96 hours after online publication and is updated daily on week days.
Initial download of the metrics may take a while.