Fig. 17
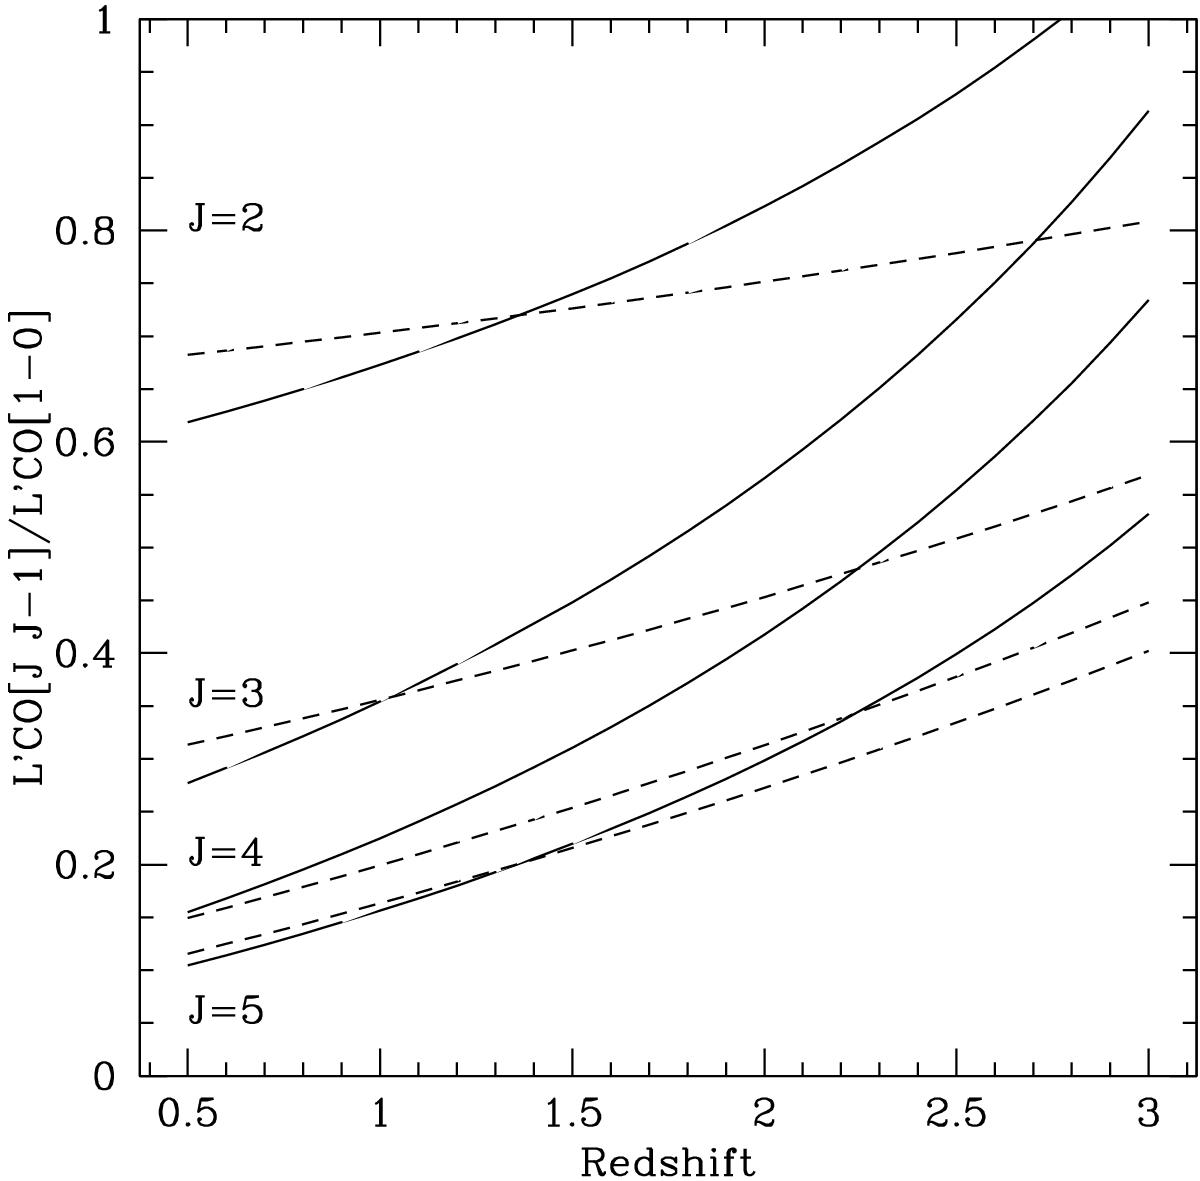
Predicted average luminosity ratios for MS galaxies of various CO transitions normalized to L′CO[1–0], exploiting the correlation between CO SLED excitation and ⟨ U ⟩ and between ⟨ U ⟩ and redshift (Magdis et al. 2012; Béthermin et al. 2015). This is computed for the J = 2,3,4,5 transitions, curves from top to bottom. We considered two-component cold and warm CO SLEDs, corresponding to the different solutions shown in Fig. 10, with the warmer component peaking at J = 5 (solid) or 7 (dashed).
Current usage metrics show cumulative count of Article Views (full-text article views including HTML views, PDF and ePub downloads, according to the available data) and Abstracts Views on Vision4Press platform.
Data correspond to usage on the plateform after 2015. The current usage metrics is available 48-96 hours after online publication and is updated daily on week days.
Initial download of the metrics may take a while.