Fig. 16
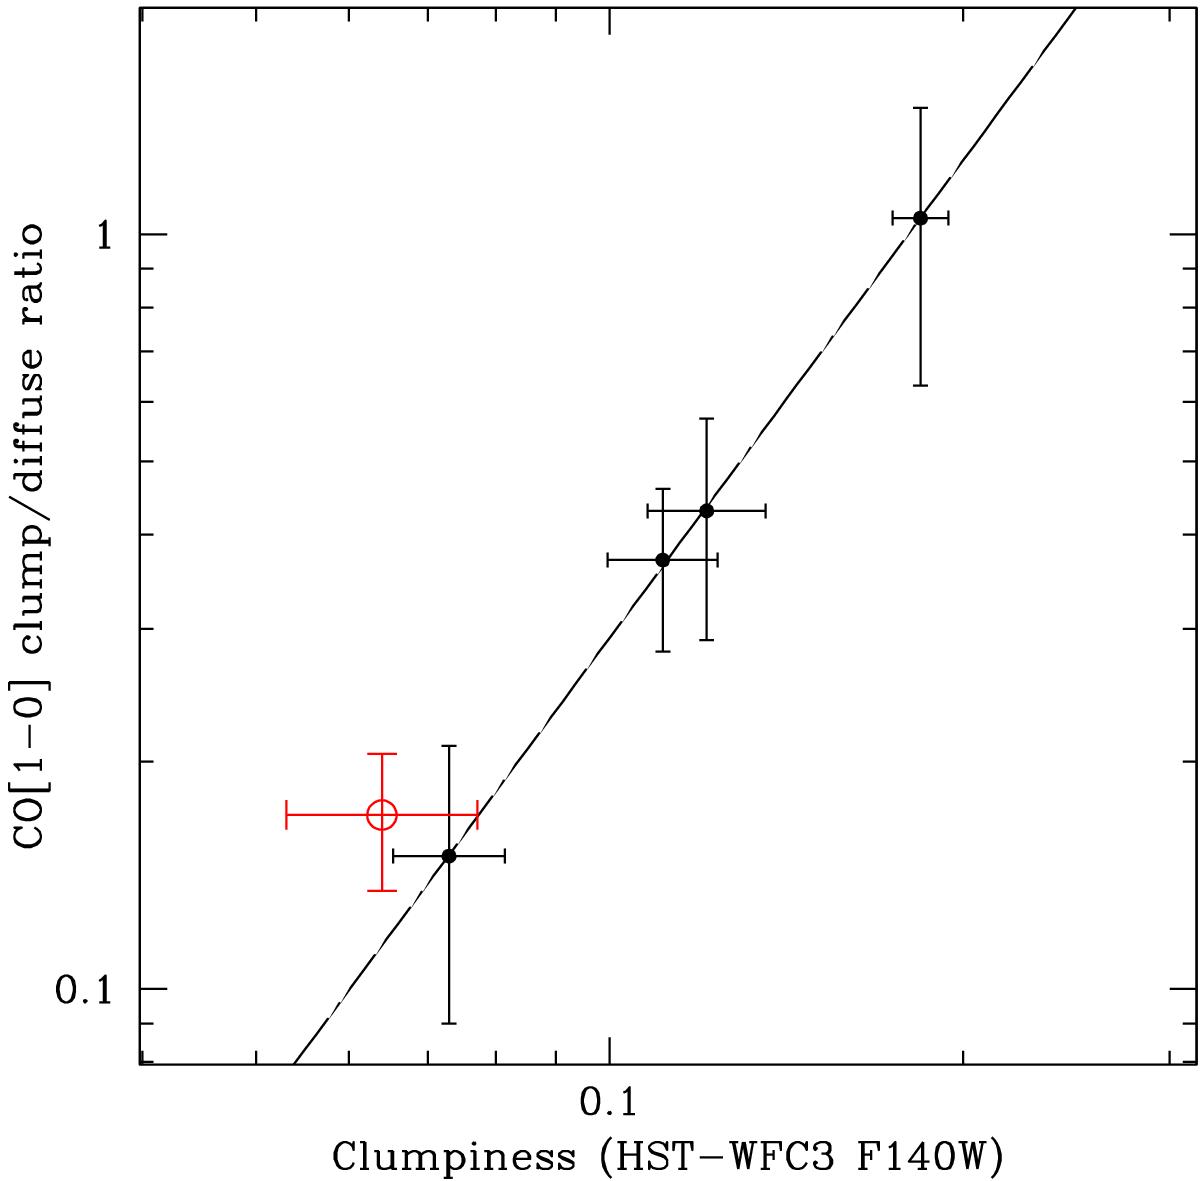
Ratio of CO[1–0] emission decomposed between clumpy and diffuse components (based on the CO SLED decomposition, as in Fig. 15) is shown as a function of the clumpiness of the light as seen in the HST-WFC3 F160W imaging (see text for details), corresponding to an optical rest frame of z = 1.5. The red circle shows the properties of the simulated disk in Bournaud et al. (2014) that appears to fit the trend consistently (solid line). The model of B15 is less clumpy than the average BzK galaxy. The fact that the solid-line fit has a χ2 ~ 0 (with 2 degrees of freedom) is just a fortuitous property of the sample, with no further parameter adjustment.
Current usage metrics show cumulative count of Article Views (full-text article views including HTML views, PDF and ePub downloads, according to the available data) and Abstracts Views on Vision4Press platform.
Data correspond to usage on the plateform after 2015. The current usage metrics is available 48-96 hours after online publication and is updated daily on week days.
Initial download of the metrics may take a while.