Fig. 11
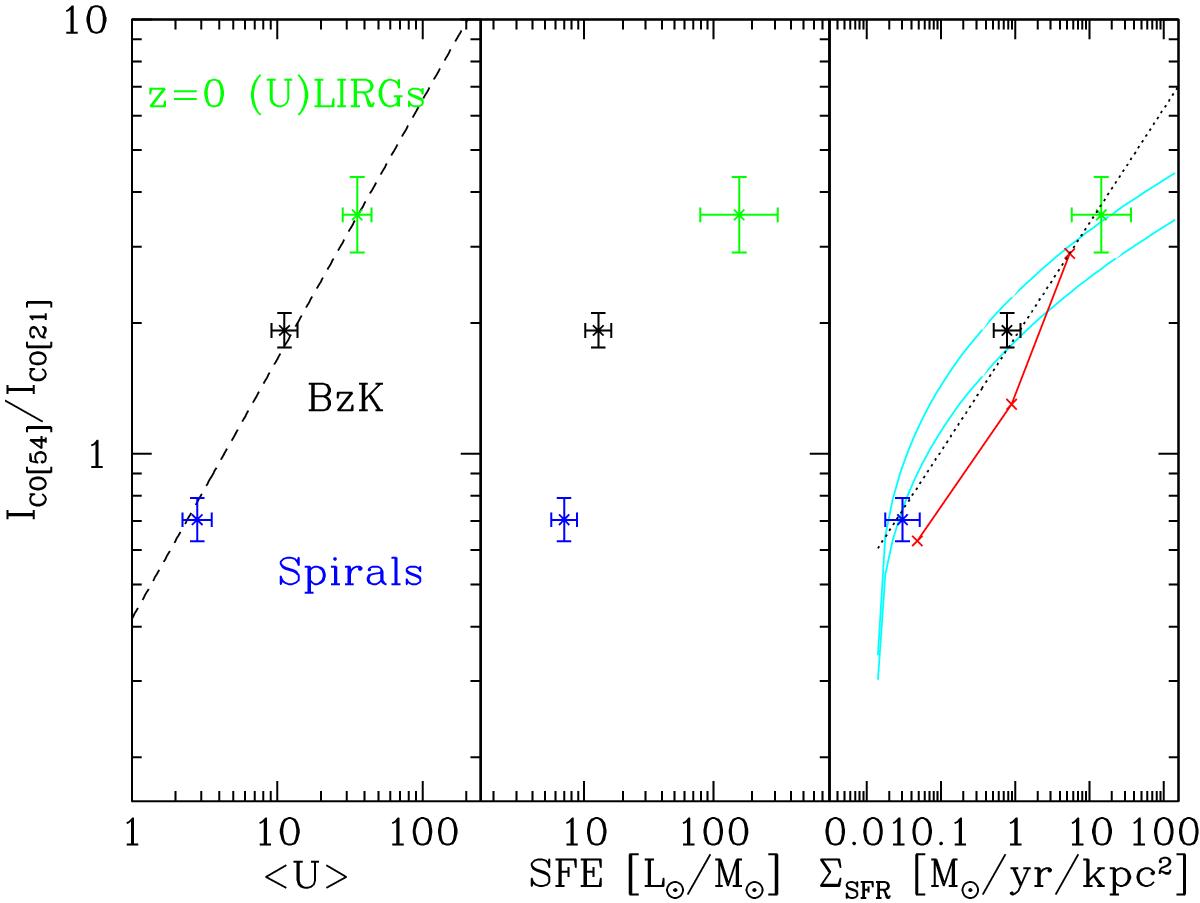
Comparison of the average CO[5–4]/CO[2–1] ratio to the average radiation field intensity (⟨ U ⟩, left panel), the star formation efficiency (SFE, center panel), and the star formation surface density (ΣSFR; right panel), for local spirals (blue), local (U)LIRGs (green), and z = 1.5 normal MS galaxies (black). The best-fitting trend (dashed line) in the left panel is given in Eq. (1), while the relation in the right panel (dotted line) is given in Eq. (3). The cyan trends (right panel) show the predictions of Narayanan & Krumholz (2014) based on their Eq. (19) and Tables 2 and 3, while in red we show the B15 simulation results.
Current usage metrics show cumulative count of Article Views (full-text article views including HTML views, PDF and ePub downloads, according to the available data) and Abstracts Views on Vision4Press platform.
Data correspond to usage on the plateform after 2015. The current usage metrics is available 48-96 hours after online publication and is updated daily on week days.
Initial download of the metrics may take a while.