Fig. 1
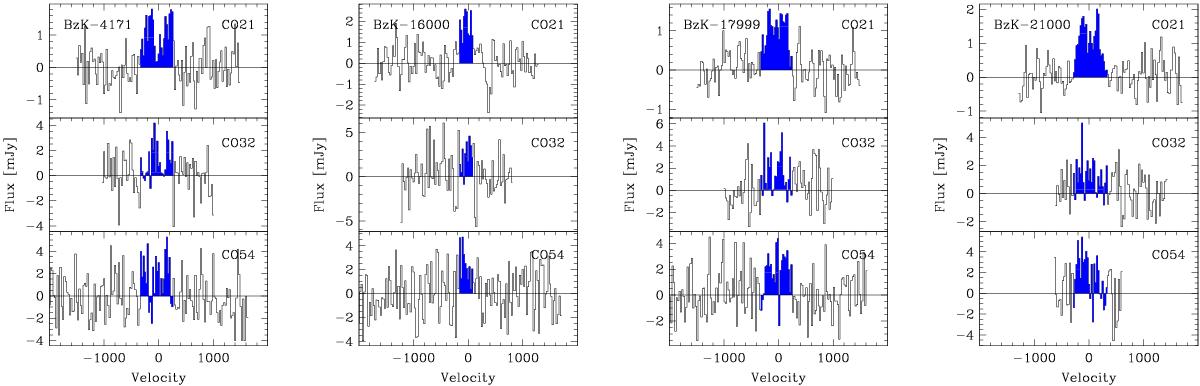
Multi-transition spectra of CO[2–1] (top), CO[3–2] (middle) and CO[5–4] (bottom), for each galaxy in our sample extracted by fitting circular Gaussian models convolved with the beam at the position of the galaxies in steps of 25 km s-1. The CO[2–1] data are taken from D10, the CO[3–2] data for BzK-21000 from Dannerbauer et al. (2009). The shaded regions correspond to the velocity range (kept fixed for all transitions of a given galaxy), over which fluxes are measured. Continuum levels as measured in the data and constrained from our multiwavelength modeling have been subtracted. Zero velocity corresponds to the accurate CO[2–1] redshifts from D10.
Current usage metrics show cumulative count of Article Views (full-text article views including HTML views, PDF and ePub downloads, according to the available data) and Abstracts Views on Vision4Press platform.
Data correspond to usage on the plateform after 2015. The current usage metrics is available 48-96 hours after online publication and is updated daily on week days.
Initial download of the metrics may take a while.