Free Access
Fig. 9
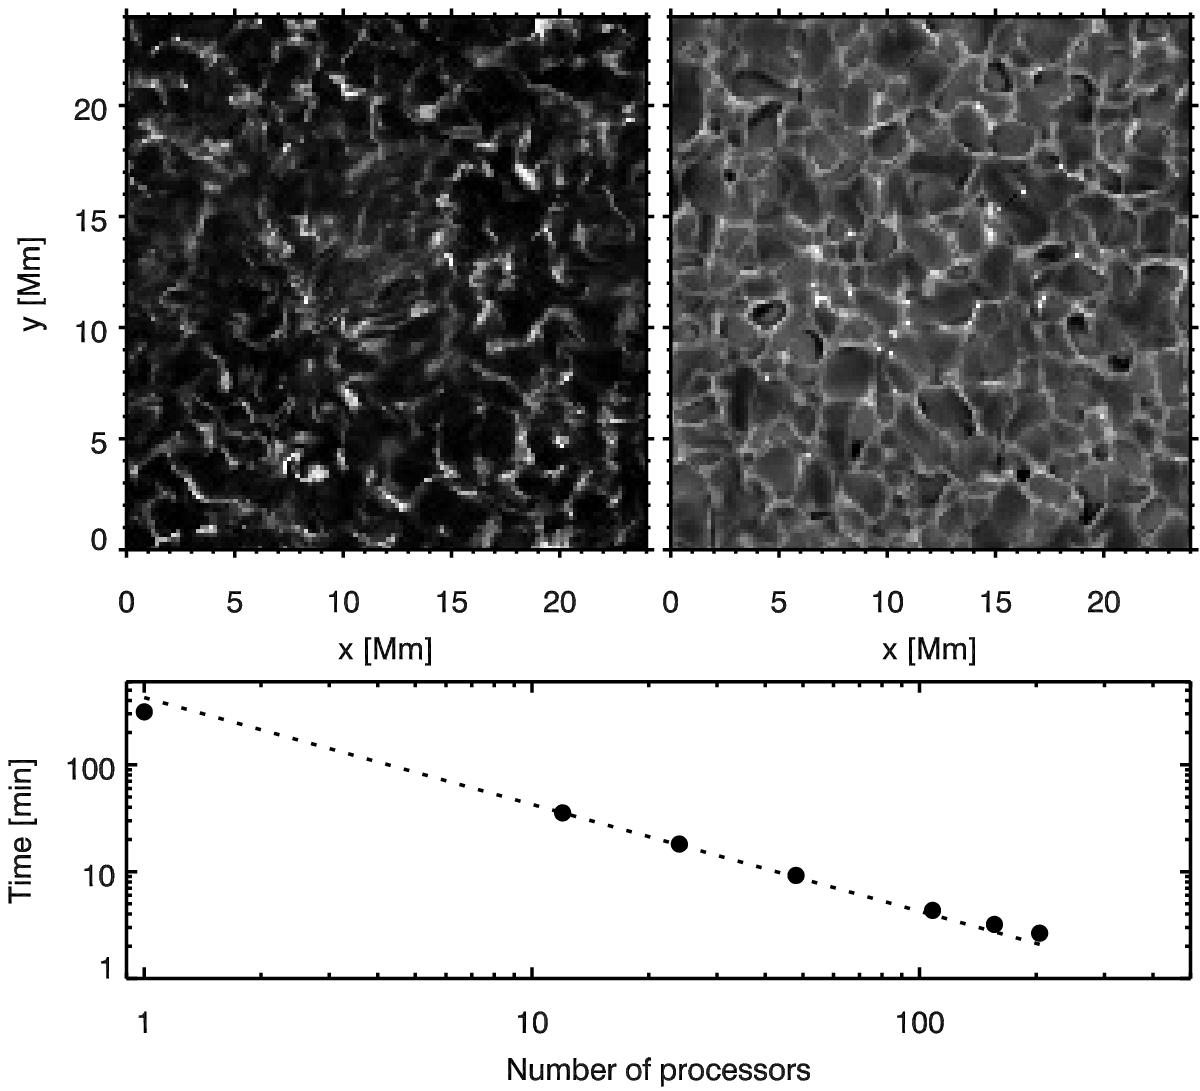
Top row: synthetic observations in the 854.2 nm line, close to line center (left panel) and in the extended photospheric wing (right panel). Bottom: CPU time as a function of the inverse number of processors. The dotted line represents the behavior expected for ideal parallelization.
Current usage metrics show cumulative count of Article Views (full-text article views including HTML views, PDF and ePub downloads, according to the available data) and Abstracts Views on Vision4Press platform.
Data correspond to usage on the plateform after 2015. The current usage metrics is available 48-96 hours after online publication and is updated daily on week days.
Initial download of the metrics may take a while.