Fig. 3
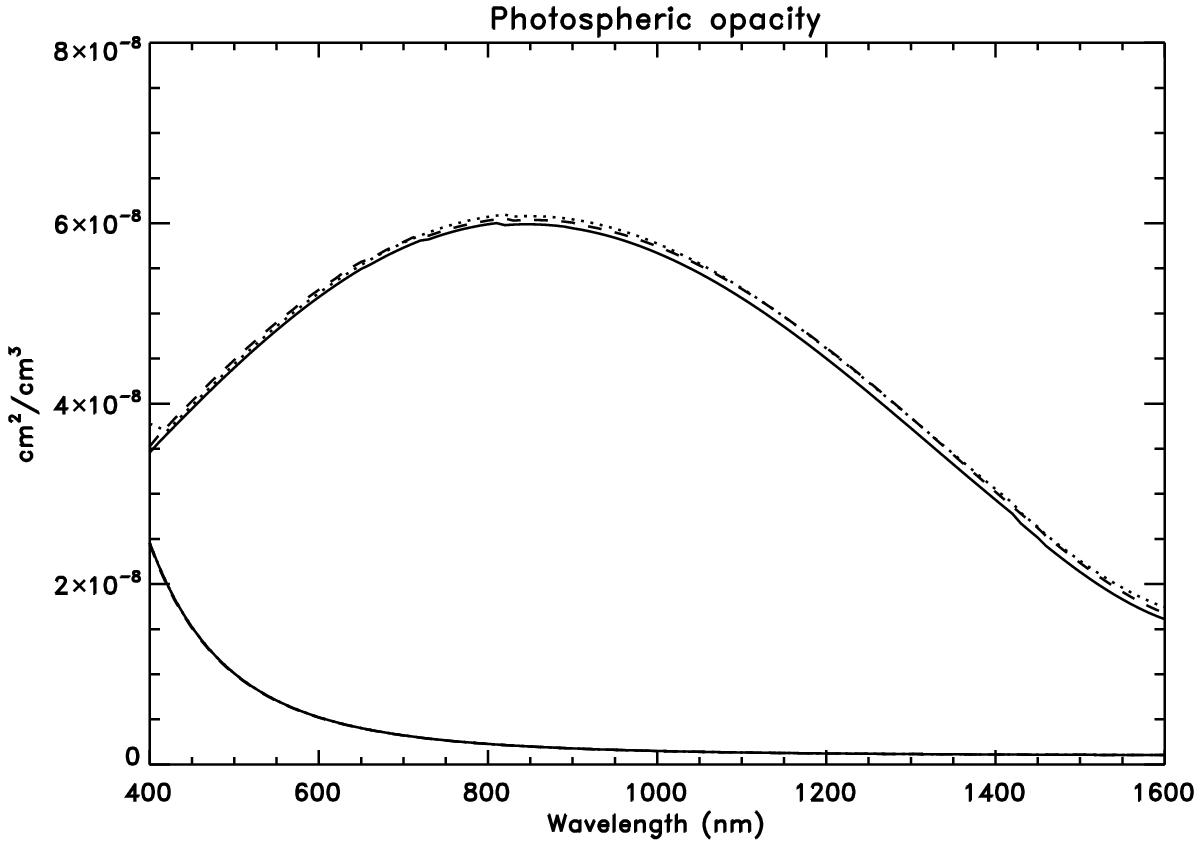
Background opacities as a function of wavelength in typical photospheric conditions (T = 5600 K, Pe = 10 dyn cm-2, Pg = 8 × 10⁵ dyn cm-2). Solid line: using the Wittmann package. Dashed line: using the NICOLE package. Dotted line: using the SOPA package. The lower curve represents the scattering contribution to the opacity (all three packages yield the same result within the line thickness of the plot). The scattering curve has been multiplied by a factor 100 for better visibility in this plot.
Current usage metrics show cumulative count of Article Views (full-text article views including HTML views, PDF and ePub downloads, according to the available data) and Abstracts Views on Vision4Press platform.
Data correspond to usage on the plateform after 2015. The current usage metrics is available 48-96 hours after online publication and is updated daily on week days.
Initial download of the metrics may take a while.