Free Access
Fig. 8
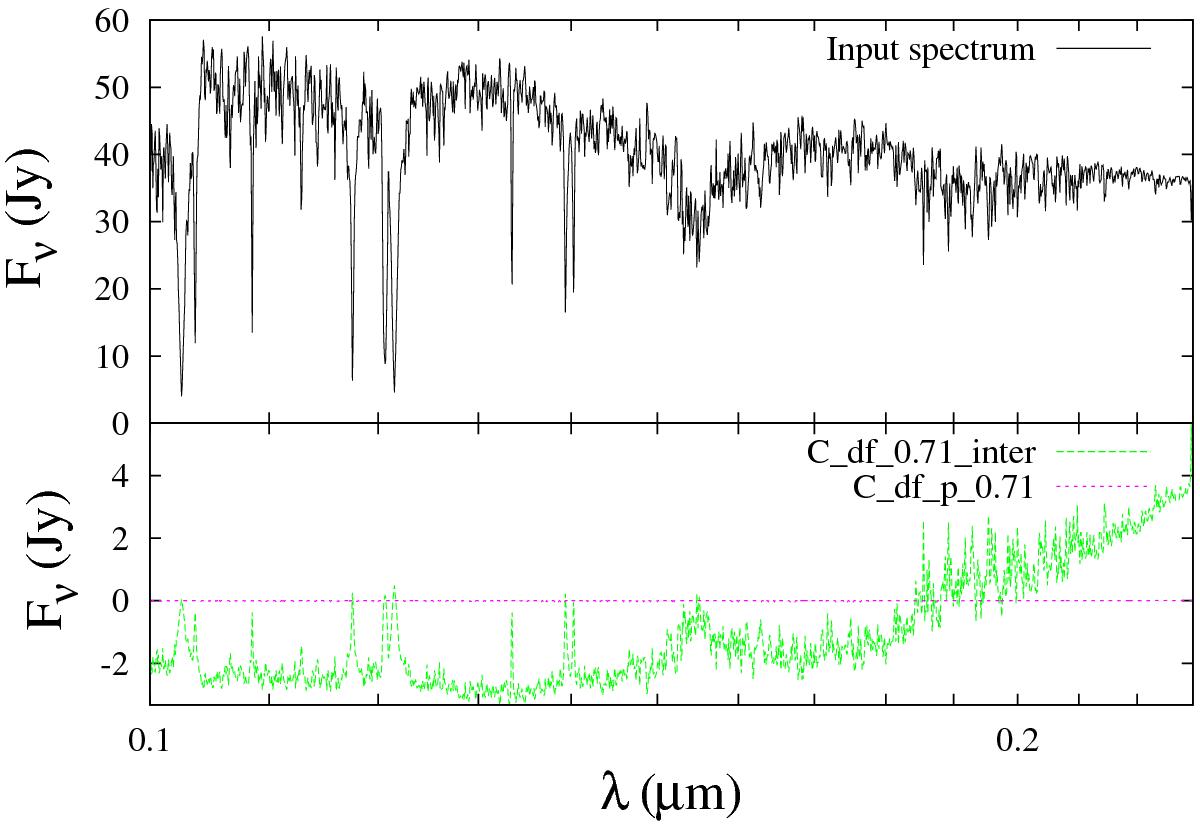
Synthetic SEDs of dust-free models in the UV regime. The solid black line in the upper panel represents the input stellar spectrum. The lower panel shows the difference between the output and input spectra for the two models identified by the line labels.
Current usage metrics show cumulative count of Article Views (full-text article views including HTML views, PDF and ePub downloads, according to the available data) and Abstracts Views on Vision4Press platform.
Data correspond to usage on the plateform after 2015. The current usage metrics is available 48-96 hours after online publication and is updated daily on week days.
Initial download of the metrics may take a while.