Fig. 6
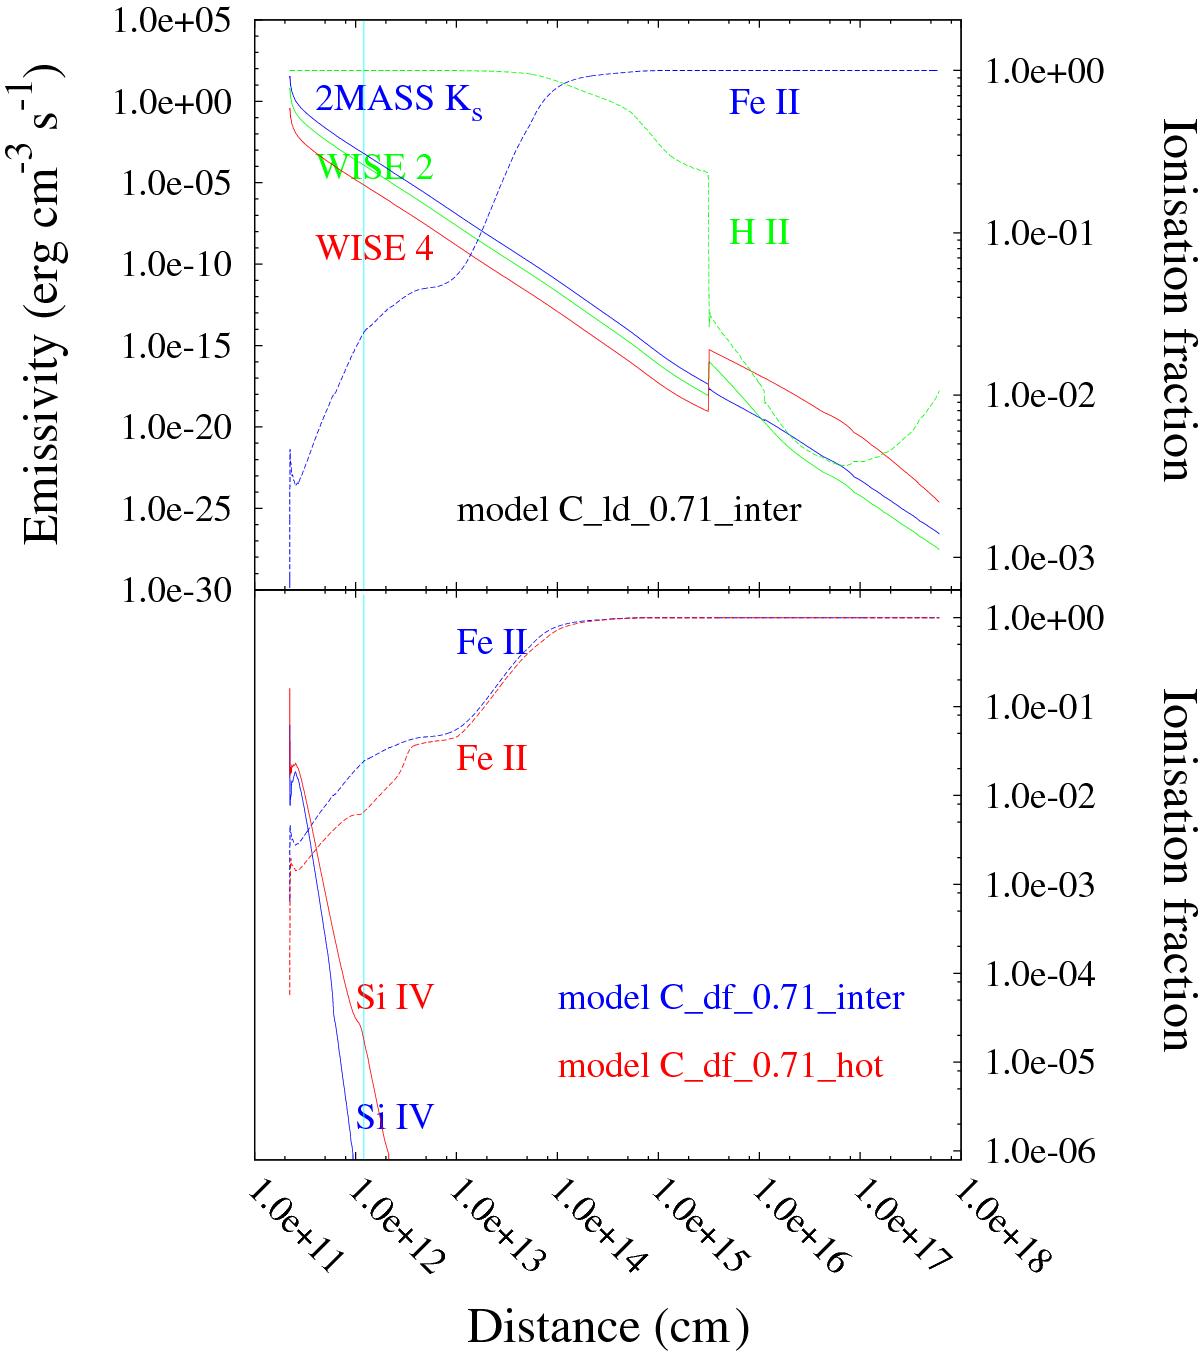
Top panel: emissivity profiles (solid lines) and relative ionisation (dashed lines) for the simulation C_ld_0.71_inter (blue solid line: 2MASS Ks; green and red solid: WISE W2 and W4, respectively; green dashed: H ii fraction; blue dashed: Fe ii fraction). The vertical cyan line represents the Roche lobe radius for the gainer star. Bottom panel: Si iv (solid lines) and Fe ii fraction (dashed lines) for the high-temperature hotspot simulations (blue: model C_df_0.71_inter; red: C_df_0.71_hot).
Current usage metrics show cumulative count of Article Views (full-text article views including HTML views, PDF and ePub downloads, according to the available data) and Abstracts Views on Vision4Press platform.
Data correspond to usage on the plateform after 2015. The current usage metrics is available 48-96 hours after online publication and is updated daily on week days.
Initial download of the metrics may take a while.