Free Access
Fig. 5
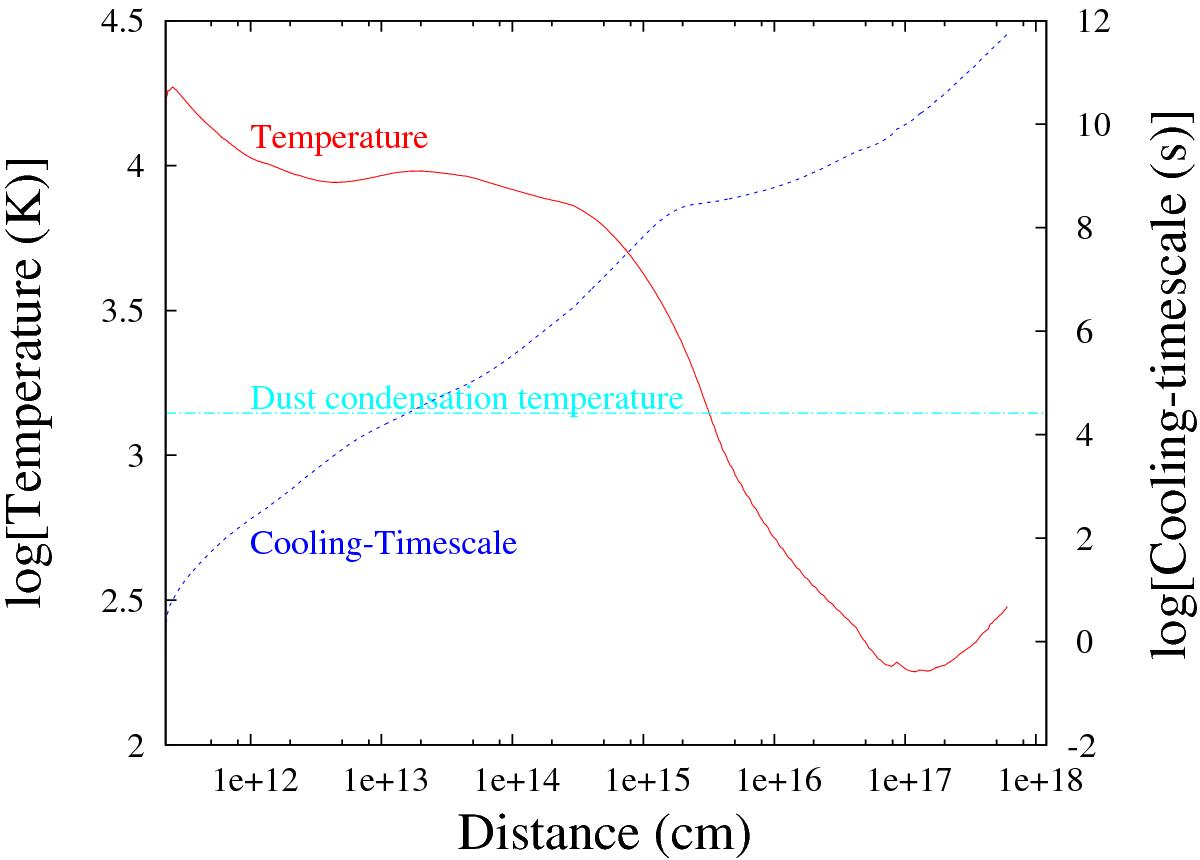
Temperature profile (solid red line) and cooling time scale (dotted blue line; see text) of the material surrounding the star as a function of distance to the star (model C_df_0.71_inter). The dot-dashed cyan line represents the dust condensation temperature (1400 K).
Current usage metrics show cumulative count of Article Views (full-text article views including HTML views, PDF and ePub downloads, according to the available data) and Abstracts Views on Vision4Press platform.
Data correspond to usage on the plateform after 2015. The current usage metrics is available 48-96 hours after online publication and is updated daily on week days.
Initial download of the metrics may take a while.