Fig. 4
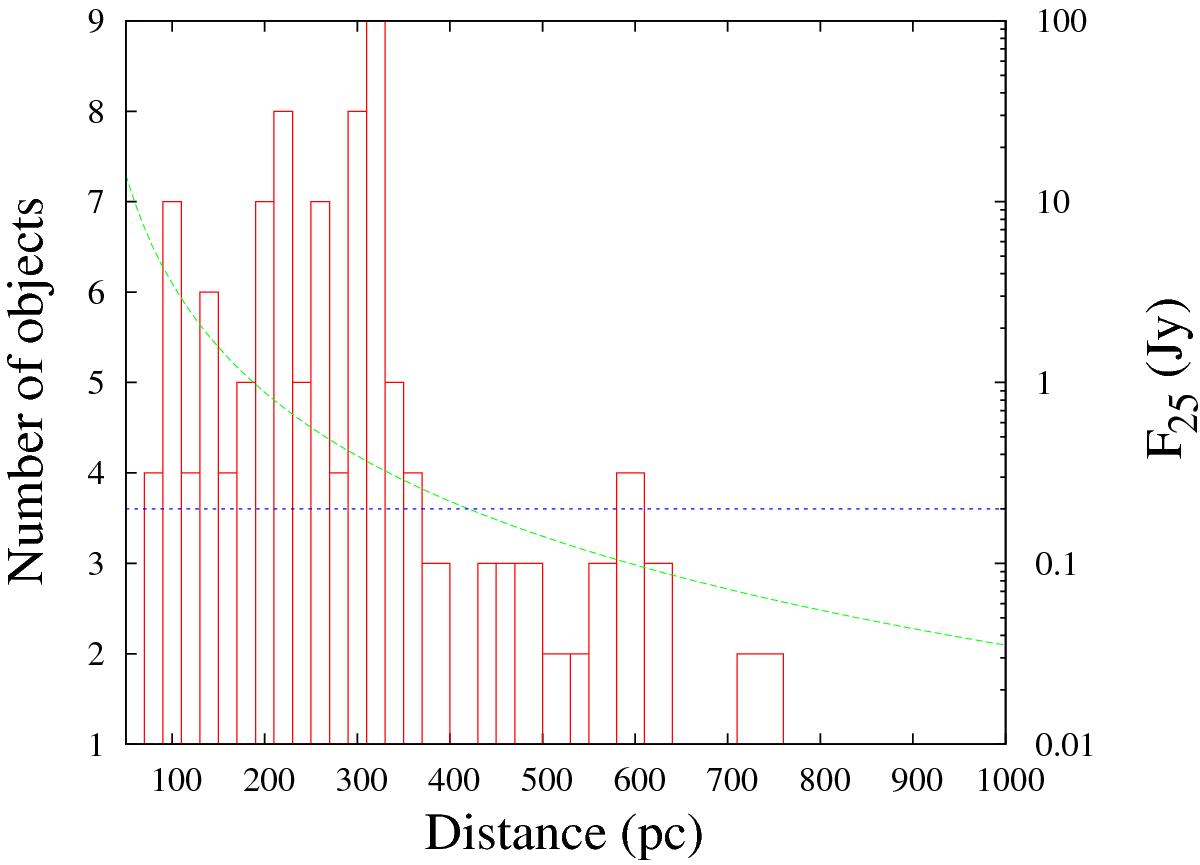
Distance distribution for observed Algols. The sample of Algols is from Budding et al. (2004). Parallaxes are from the Hipparcos catalogue (ESA 1997). The dashed green curve represents the flux at 25 μm (right-hand scale) as a function of distance for the dusty simulation C_ld_0.71_inter. The flux is integrated over the whole nebula. The dotted blue line is the IRAS 5σ limit at 25 μm. The WISE 5σ limit for band W4 is 2600 μJy and is always below the dashed green curve.
Current usage metrics show cumulative count of Article Views (full-text article views including HTML views, PDF and ePub downloads, according to the available data) and Abstracts Views on Vision4Press platform.
Data correspond to usage on the plateform after 2015. The current usage metrics is available 48-96 hours after online publication and is updated daily on week days.
Initial download of the metrics may take a while.