Fig. 2
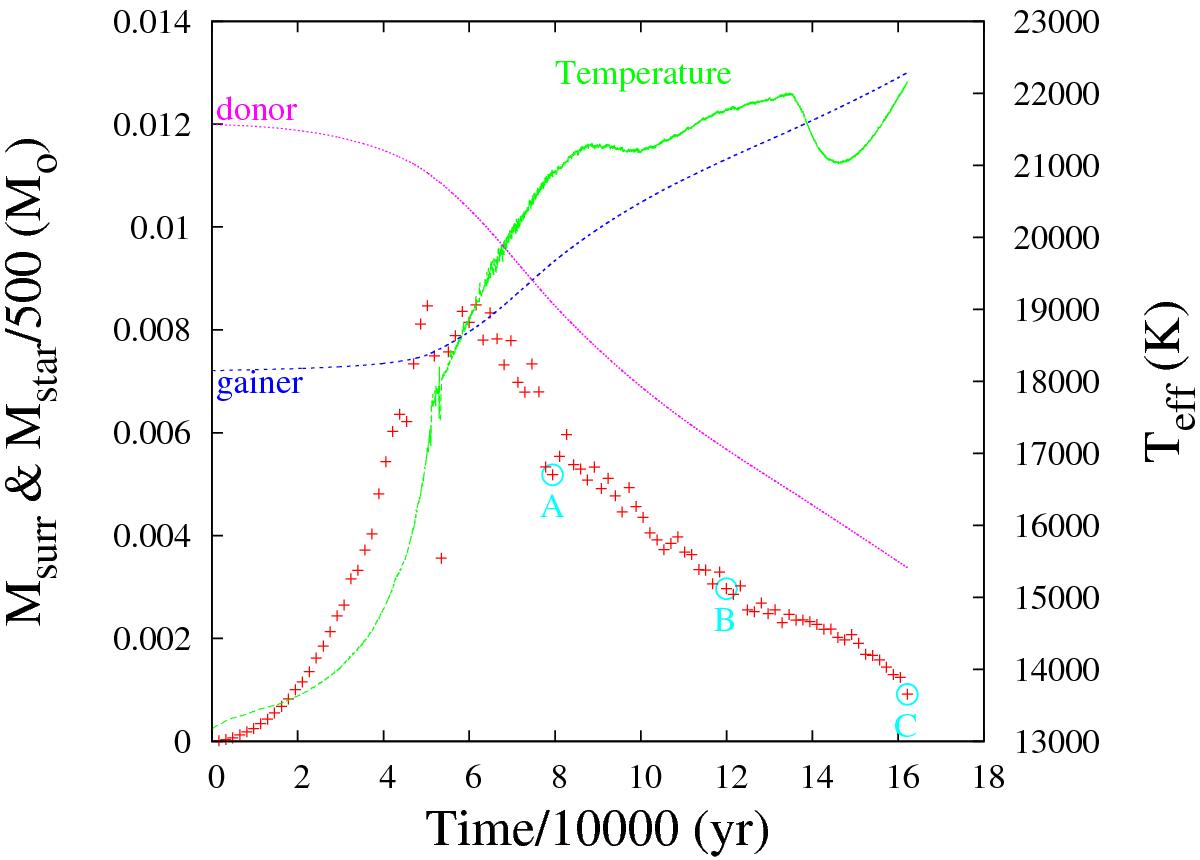
Red crosses: evolution of the mass surrounding the system (integrated up to the radius where the density of the outflow equals the ISM density; see text). The cyan circles (labelled with the model name) indicate the models selected for the simulations presented in this work. Long-dashed green line (right-hand scale): evolution of the gainer-star surface temperature. Magenta dotted line and dashed blue line: evolution of the masses of the donor and gainer (in unit of M⊙/ 500).
Current usage metrics show cumulative count of Article Views (full-text article views including HTML views, PDF and ePub downloads, according to the available data) and Abstracts Views on Vision4Press platform.
Data correspond to usage on the plateform after 2015. The current usage metrics is available 48-96 hours after online publication and is updated daily on week days.
Initial download of the metrics may take a while.