Fig. 12
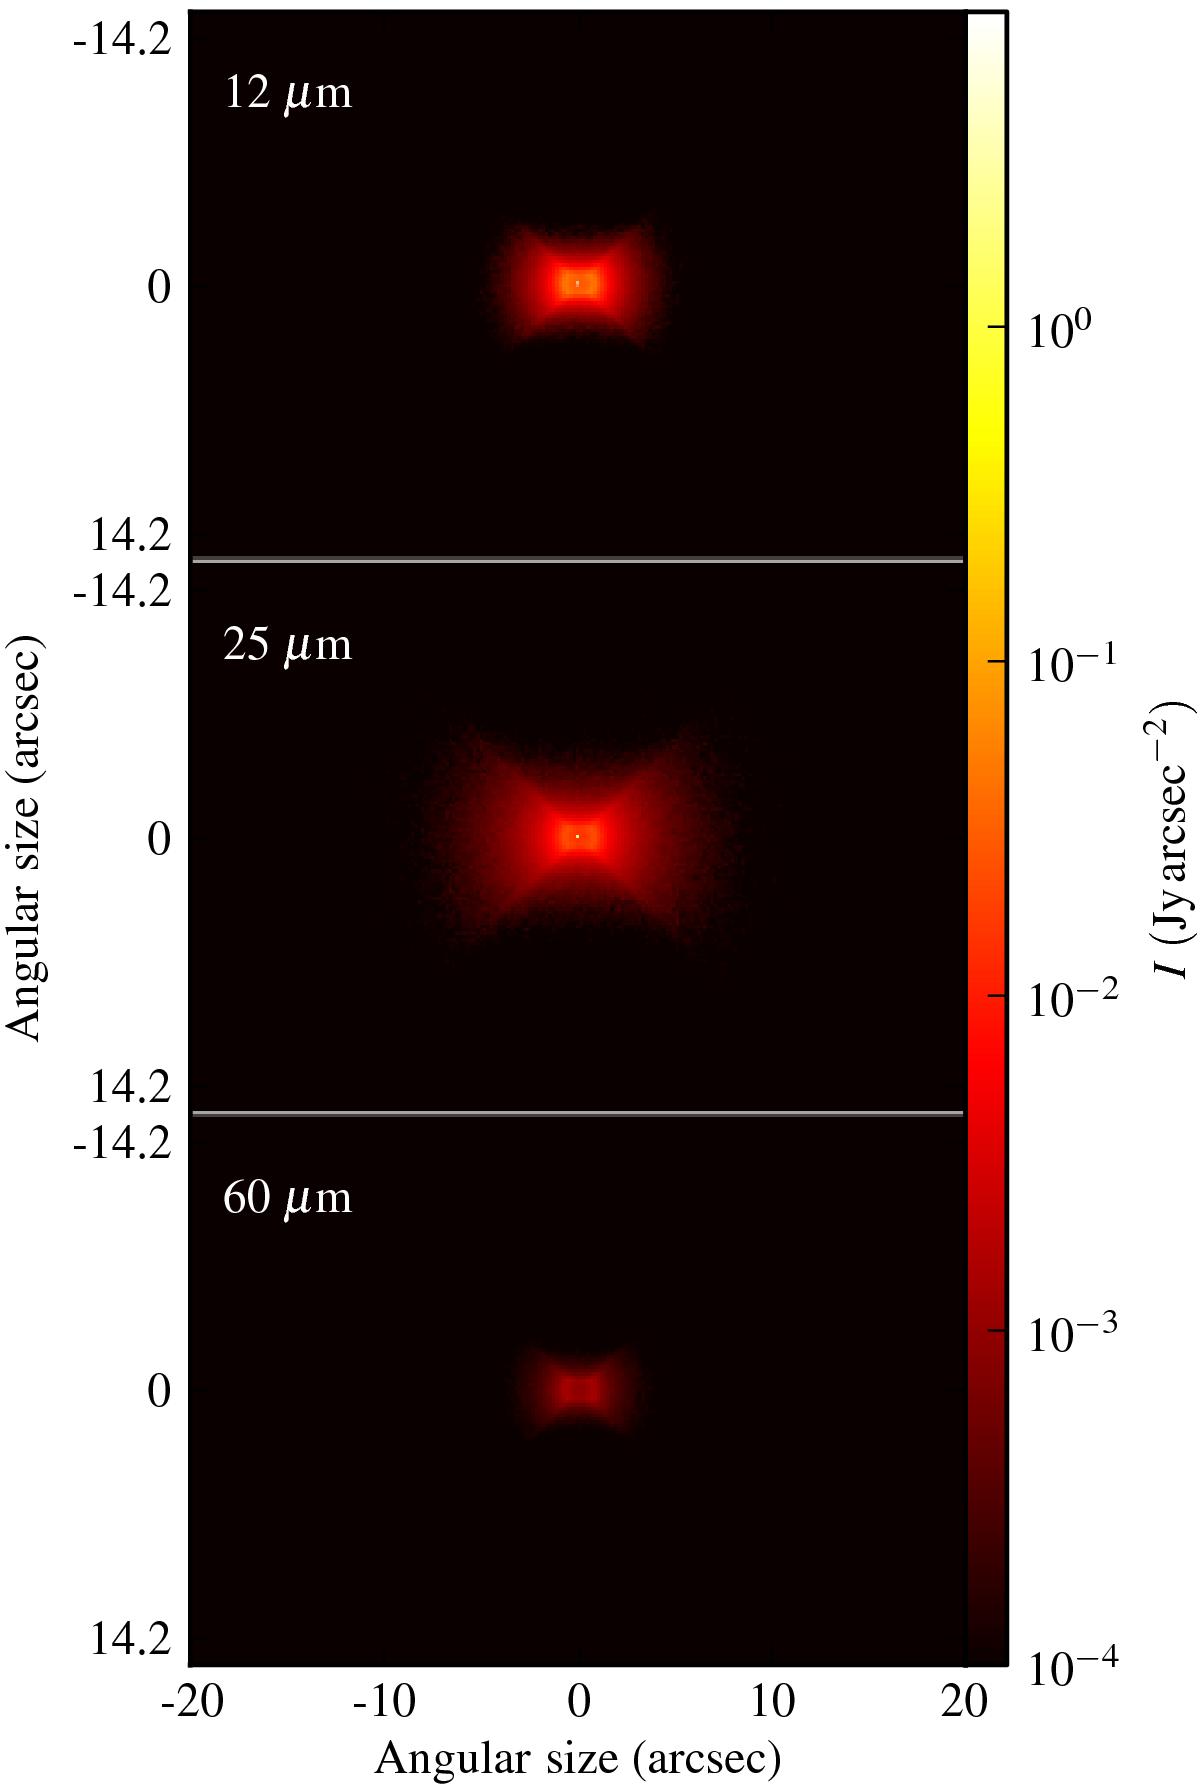
Skirt intensity map at 12 μm (top), 25 μm (middle), and 60 μm (bottom) for Φ = 2 × 10⁻⁵ (model C_SK_ld). To ease the comparison, the same limits are used for the three bands for the “x” and “y” axes. The angular size and intensity are given for a system at 300 pc. The figure is zoomed on a box 12 000 × 8516 AU2 wide.
Current usage metrics show cumulative count of Article Views (full-text article views including HTML views, PDF and ePub downloads, according to the available data) and Abstracts Views on Vision4Press platform.
Data correspond to usage on the plateform after 2015. The current usage metrics is available 48-96 hours after online publication and is updated daily on week days.
Initial download of the metrics may take a while.