Fig. 10
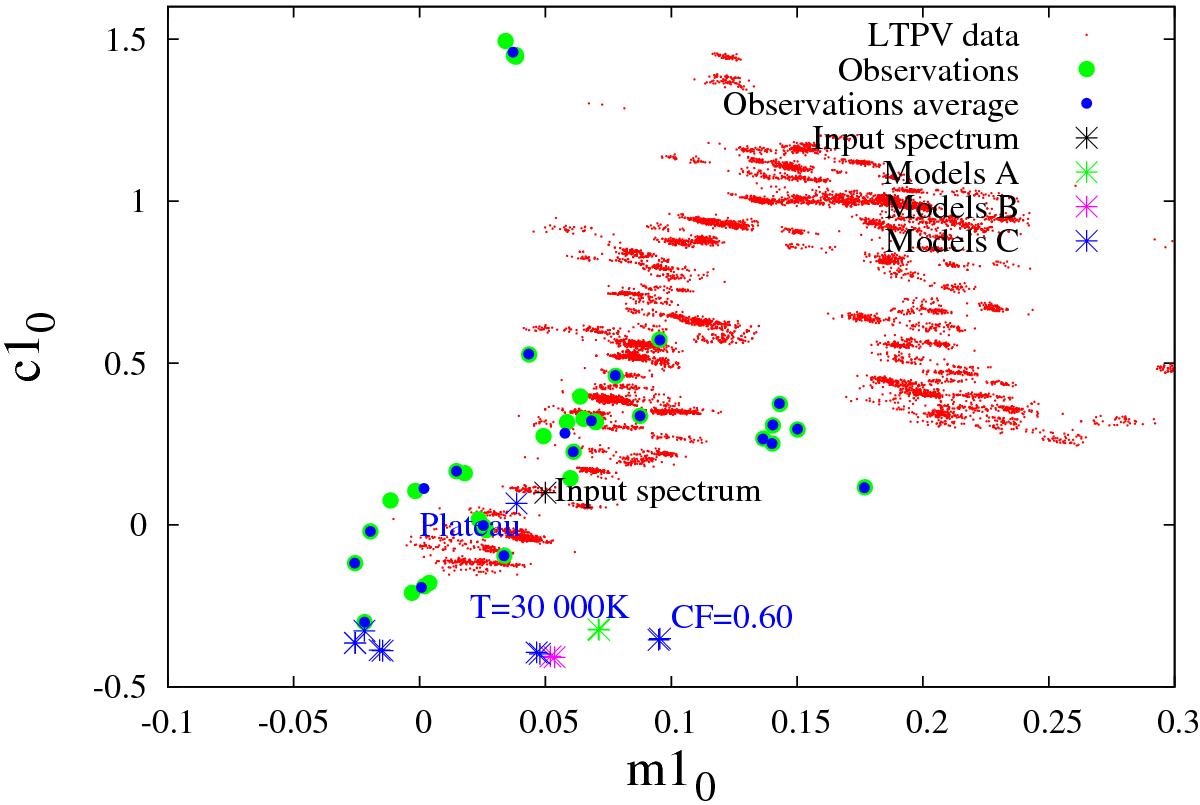
Strömgren photometry [m10; c10] diagram for our models (crosses) and for comparison, normal main-sequence stars (red dots) from the Long-Term Photometry of Variables project (Manfroid et al. 1991, to be discussed in Sect. 4.3). From the latter, only data obtained with the Danish telescope (system 7) were retained. For clarity, the models are not labelled, and only their general properties are indicated in blue. We refer to Table 3 for the values. We added observations of W Ser, B[e], and Be stars for comparison (green dots). The blue dots are the average values for the latter objects when several observations are available.
Current usage metrics show cumulative count of Article Views (full-text article views including HTML views, PDF and ePub downloads, according to the available data) and Abstracts Views on Vision4Press platform.
Data correspond to usage on the plateform after 2015. The current usage metrics is available 48-96 hours after online publication and is updated daily on week days.
Initial download of the metrics may take a while.