Fig. 4
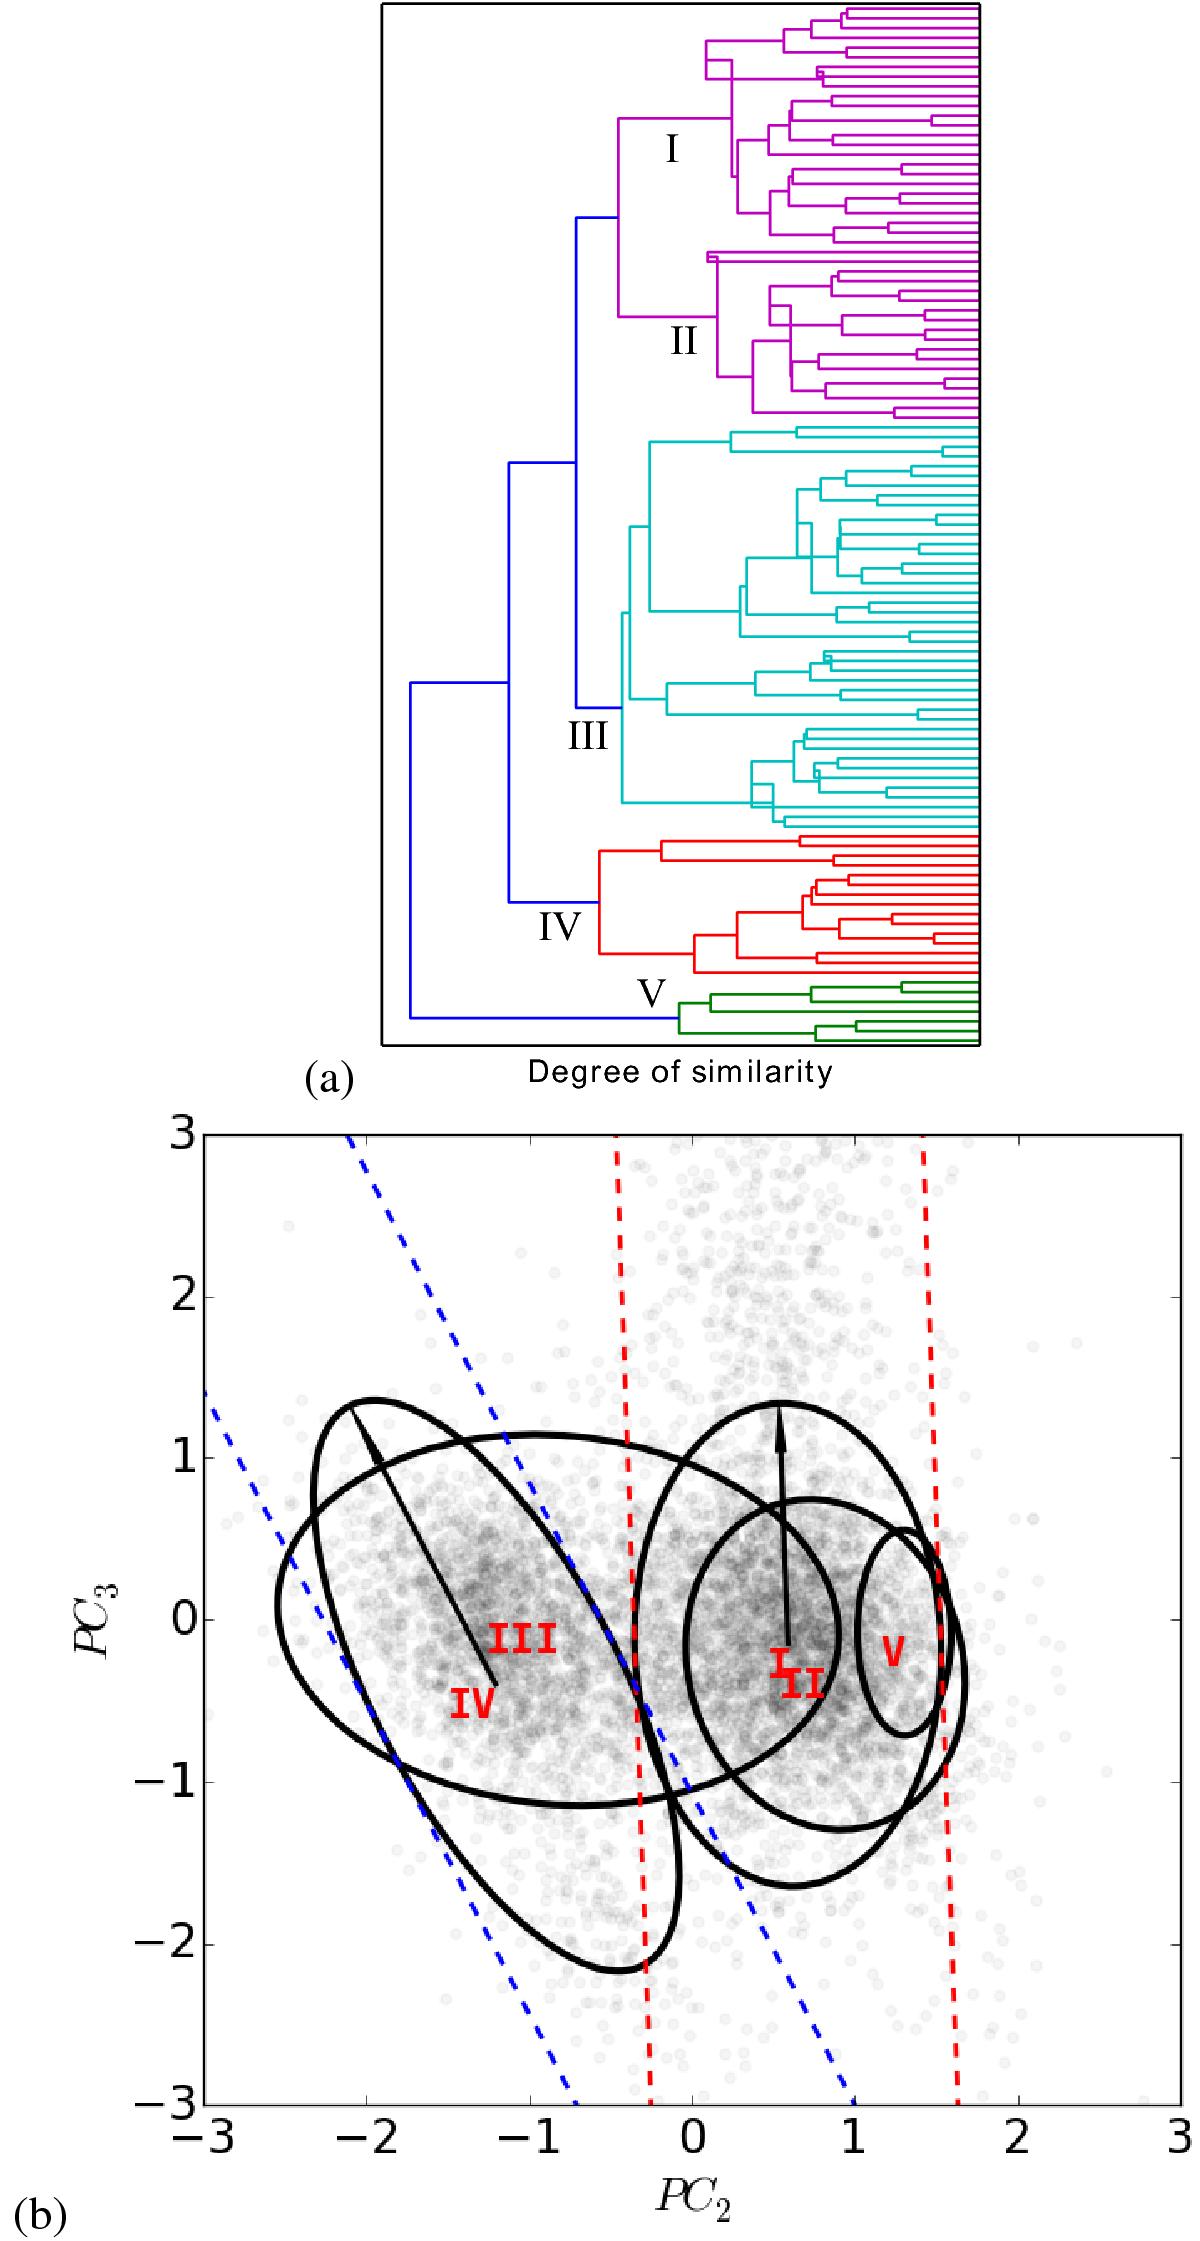
a) Binary tree dendrogram. Each superior node supports several lower pairs. Different colors highlight the biggest nodes. b) Trends. The ellipses are the representation in PC space of the nodes of same roman letter in panel a). The nodes I and IV represent the equation for the Blue and Red trends. The contours are the projected ellipsoids. The dotted lines are the projected cylinder obtained through the secondary eigenvectors of the variance-covariance matrix of the I and IV nodes.
Current usage metrics show cumulative count of Article Views (full-text article views including HTML views, PDF and ePub downloads, according to the available data) and Abstracts Views on Vision4Press platform.
Data correspond to usage on the plateform after 2015. The current usage metrics is available 48-96 hours after online publication and is updated daily on week days.
Initial download of the metrics may take a while.