Fig. 9
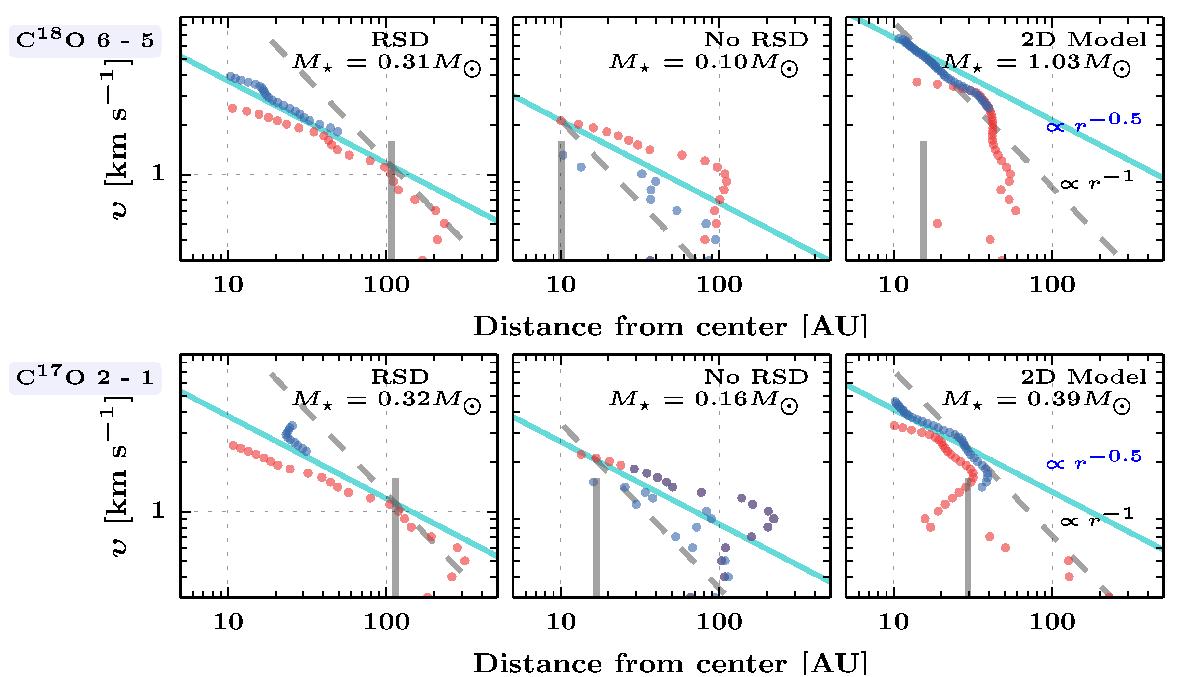
Peak position-velocity (PPV) diagrams of C18O 6–5 (top) and C17O 2–1 (bottom) at i = 45° after convolution with a 0.1″ beam. The red and blue symbols correspond to the red- and blue-shifted velocity components, respectively. The different panels present the PPV for the different simulations. Vertical solid lines show the disk radii extracted for the three models, dashed lines show the steep velocity profile (υ ∝ r-1), and the solid cyan lines indicate the Keplerian curves. The stellar masses are indicated in the top right of each panel. The offset between blue- and red-shifted points are due to the limited spatial and spectral resolution at the high velocities.
Current usage metrics show cumulative count of Article Views (full-text article views including HTML views, PDF and ePub downloads, according to the available data) and Abstracts Views on Vision4Press platform.
Data correspond to usage on the plateform after 2015. The current usage metrics is available 48-96 hours after online publication and is updated daily on week days.
Initial download of the metrics may take a while.