Fig. 7
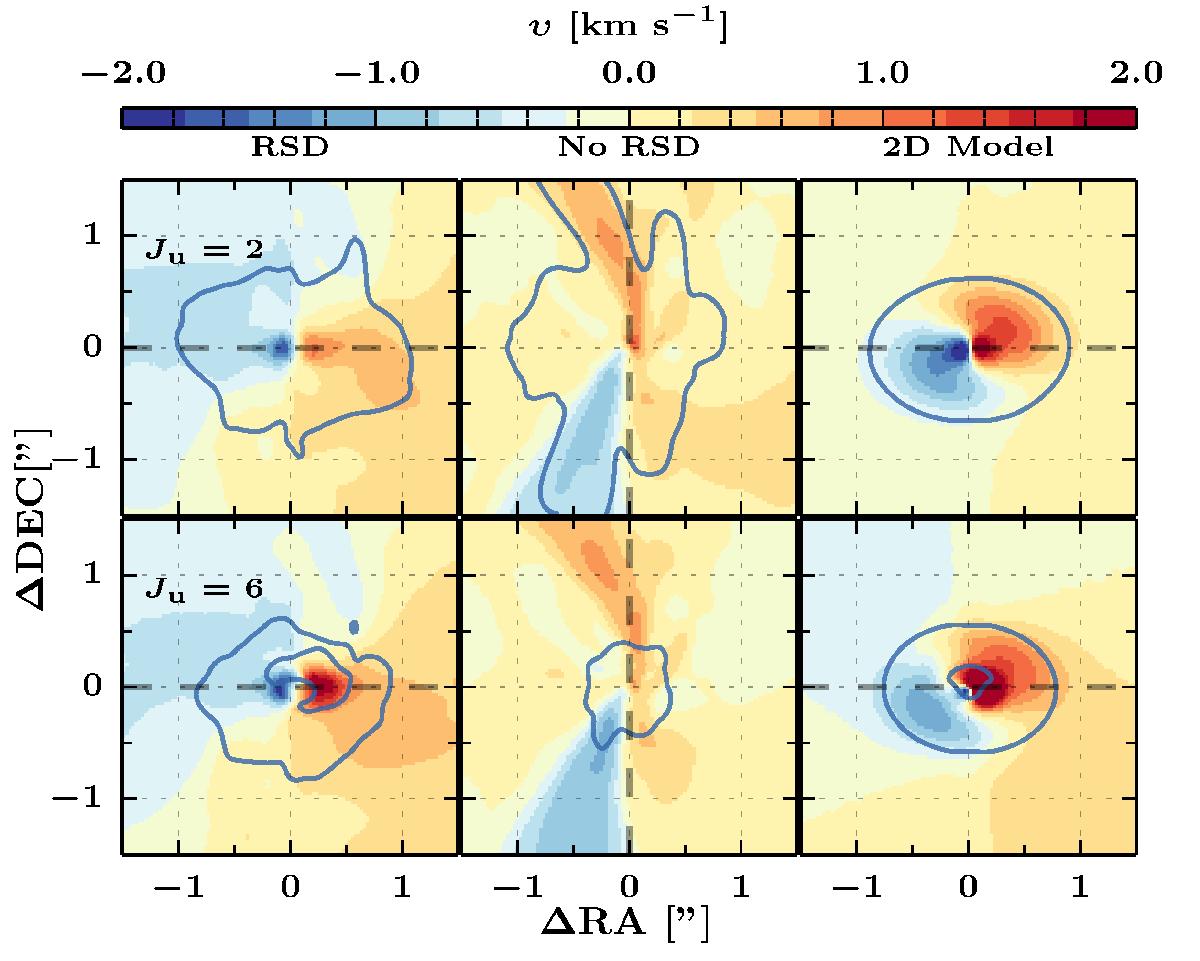
First moment maps of C18O 2–1 (top) and 6–5 (bottom) for the three simulations viewed i = 45° convolved with a 0.1″ beam. The solid line shows the 20% intensity contour of the moment zero (![]() ) peak map to indicate the flattened structure. The black dashed lines indicate the direction at which the PV slices are constructed and the direction of the elongation in the zeroth moment maps.
) peak map to indicate the flattened structure. The black dashed lines indicate the direction at which the PV slices are constructed and the direction of the elongation in the zeroth moment maps.
Current usage metrics show cumulative count of Article Views (full-text article views including HTML views, PDF and ePub downloads, according to the available data) and Abstracts Views on Vision4Press platform.
Data correspond to usage on the plateform after 2015. The current usage metrics is available 48-96 hours after online publication and is updated daily on week days.
Initial download of the metrics may take a while.