Free Access
Fig. 6
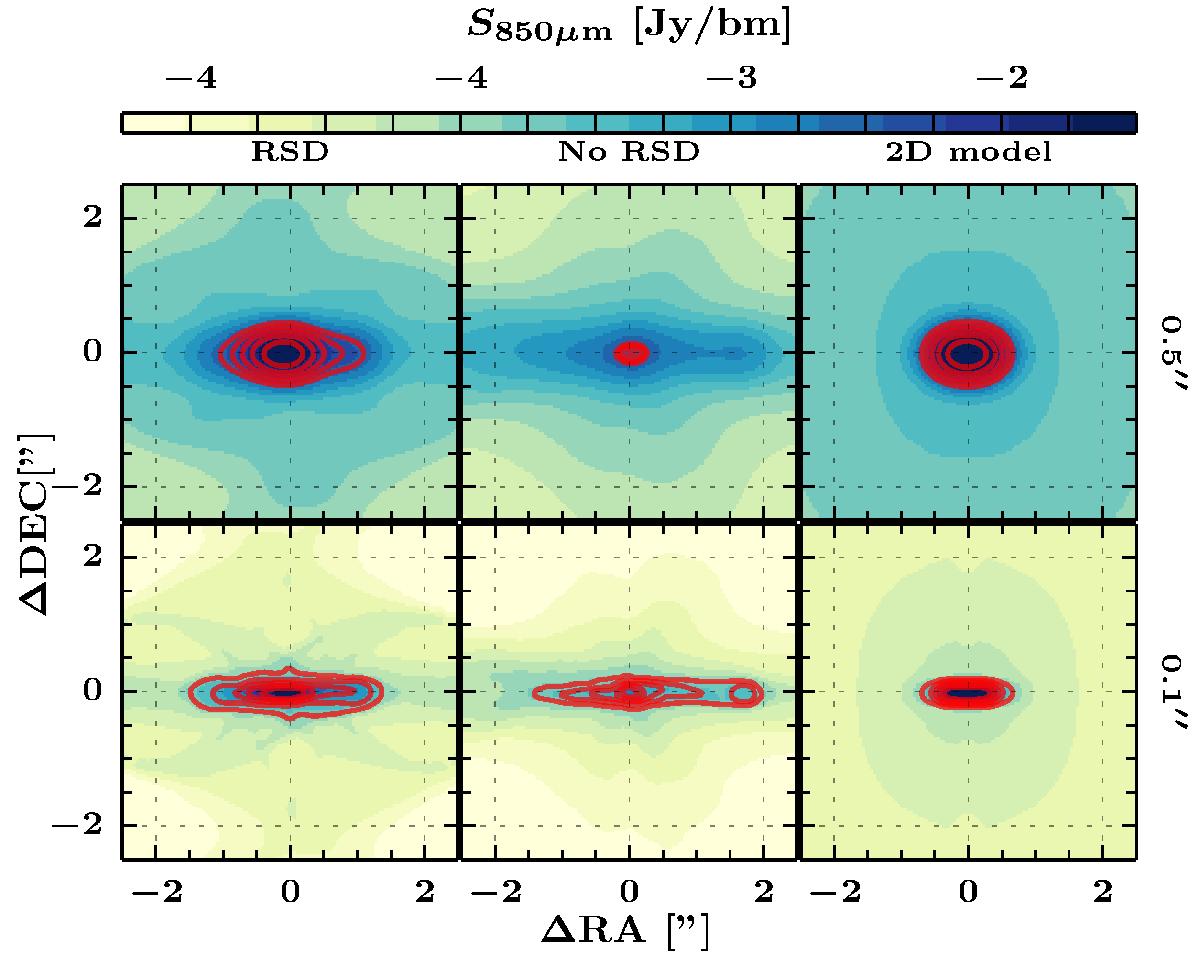
Synthetic 850 μm continuum images convolved with 0.5″ (top) and 0.1″ (bottom) beams for the three simulations viewed at 90° (edge-on): RSD formation (left), pseudo-disk (center), and 2D semi-analytical model (right). The red solid lines are drawn at the same contours as in Fig. 5.
Current usage metrics show cumulative count of Article Views (full-text article views including HTML views, PDF and ePub downloads, according to the available data) and Abstracts Views on Vision4Press platform.
Data correspond to usage on the plateform after 2015. The current usage metrics is available 48-96 hours after online publication and is updated daily on week days.
Initial download of the metrics may take a while.