Fig. 14
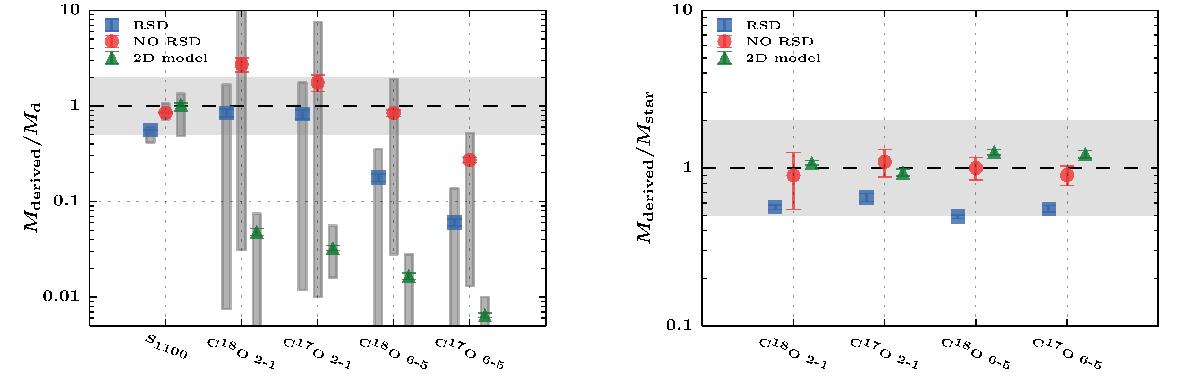
Left: mean deviation of disk masses (gas + dust) derived from 1100 μm continuum and molecular lines fluxes from the true disk mass extracted from the simulations. The gray bars indicate the full range of values for the different orientations. Right: mean deviation of stellar masses measured from molecular lines from the true stellar mass. The colors indicate the different simulations: 3D MHD simulations in blue, 3D MHD pseudo-disk simulation in red, and 2D semi-analytical model in green. The error bars indicate the standard error of the mean. The shaded region shows the area within a factor of 2.
Current usage metrics show cumulative count of Article Views (full-text article views including HTML views, PDF and ePub downloads, according to the available data) and Abstracts Views on Vision4Press platform.
Data correspond to usage on the plateform after 2015. The current usage metrics is available 48-96 hours after online publication and is updated daily on week days.
Initial download of the metrics may take a while.