Fig. 13
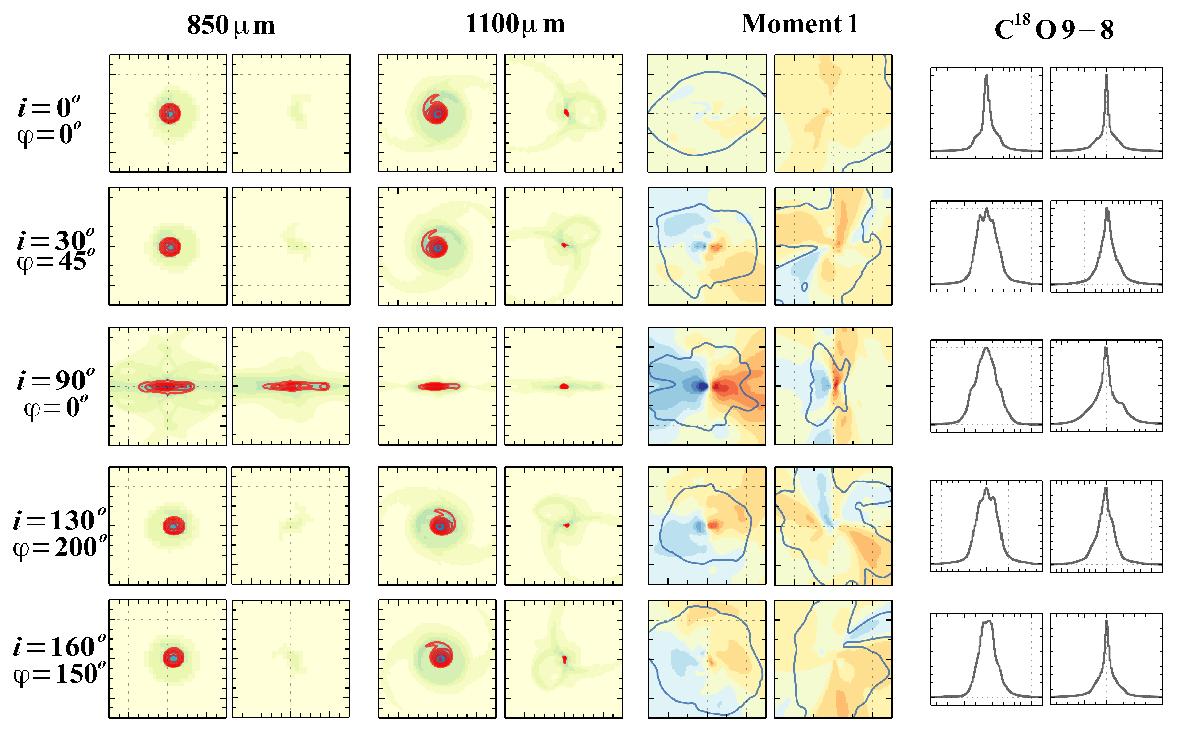
Comparison of synthetic 850 μm, 1100 μm, C18O 2–1 first moment maps and normalized C18O 9–8 spectra for the 3D RSD (left) and pseudo-disk (right) MHD simulations viewed at a few orientations. The images and image cubes are convolved with a 0.1″ beam. The maps sizes are 5″ across similar to Fig. 5. The color scales and line contours are defined in Figs. 5 and 7. The normalized C18O 9–8 spectra refer to a 15″ beam on the same scale as Fig. 11. The inclination (i) and azimuthal angle (φ, rotation angle of the observer around the z axis) are representative only and not exact.
Current usage metrics show cumulative count of Article Views (full-text article views including HTML views, PDF and ePub downloads, according to the available data) and Abstracts Views on Vision4Press platform.
Data correspond to usage on the plateform after 2015. The current usage metrics is available 48-96 hours after online publication and is updated daily on week days.
Initial download of the metrics may take a while.