Fig. 12
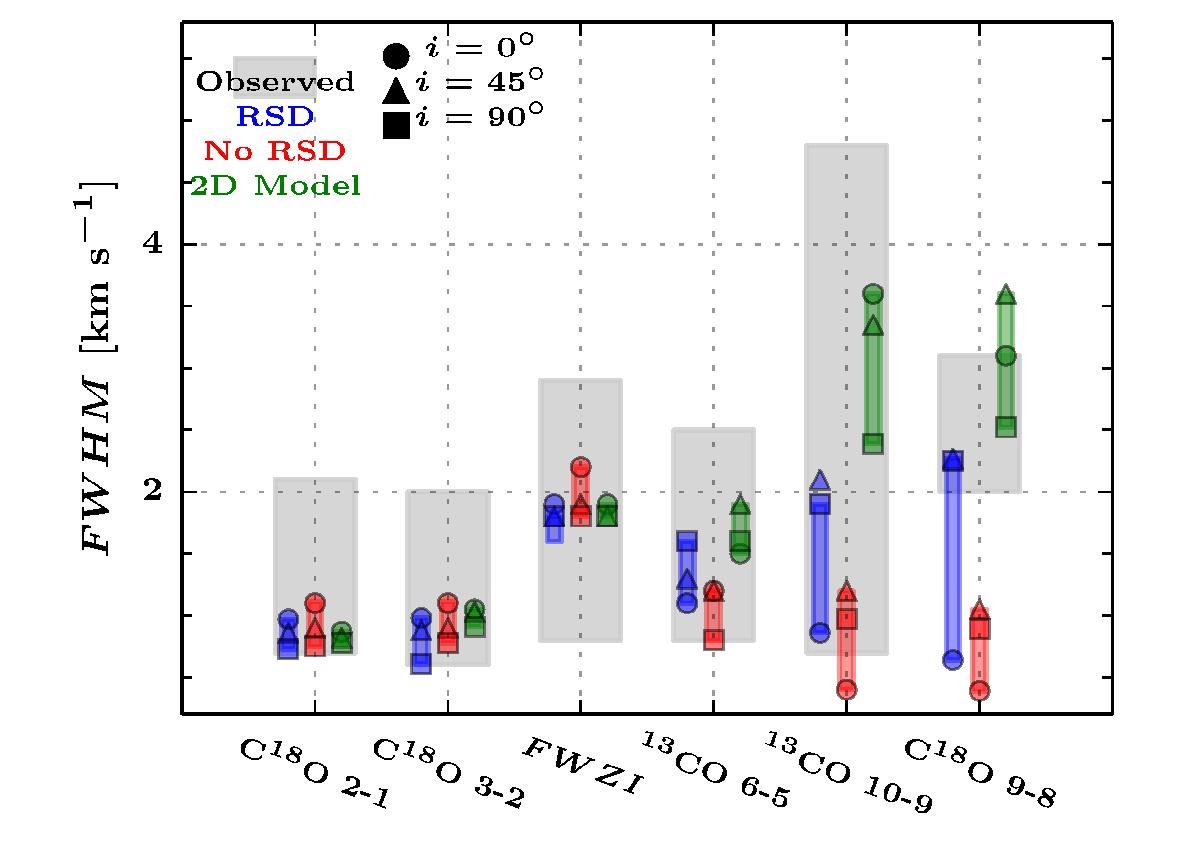
FWHM values of the observed (gray-shaded region) and simulated (symbols) rotational lines of 13CO and C18O as indicated in a 20″ beam. The observed values are taken from Jørgensen et al. (2002), van Kempen et al. (2009a), and San Jose-Garcia et al. (2013). The FWHM of synthetic lines are indicated at specific inclinations as indicated by the symbols: circles for 0°, triangles for 45°, and squares for 90°. The comparison of the FWZI values are specifically for the C18O 3–2 line. The different colors represent the different types of simulations: 3D RSD (RSD), 3D pseudo-disk (no RSD), and 2D semi-analytical model (2D Model).
Current usage metrics show cumulative count of Article Views (full-text article views including HTML views, PDF and ePub downloads, according to the available data) and Abstracts Views on Vision4Press platform.
Data correspond to usage on the plateform after 2015. The current usage metrics is available 48-96 hours after online publication and is updated daily on week days.
Initial download of the metrics may take a while.