Fig. 10
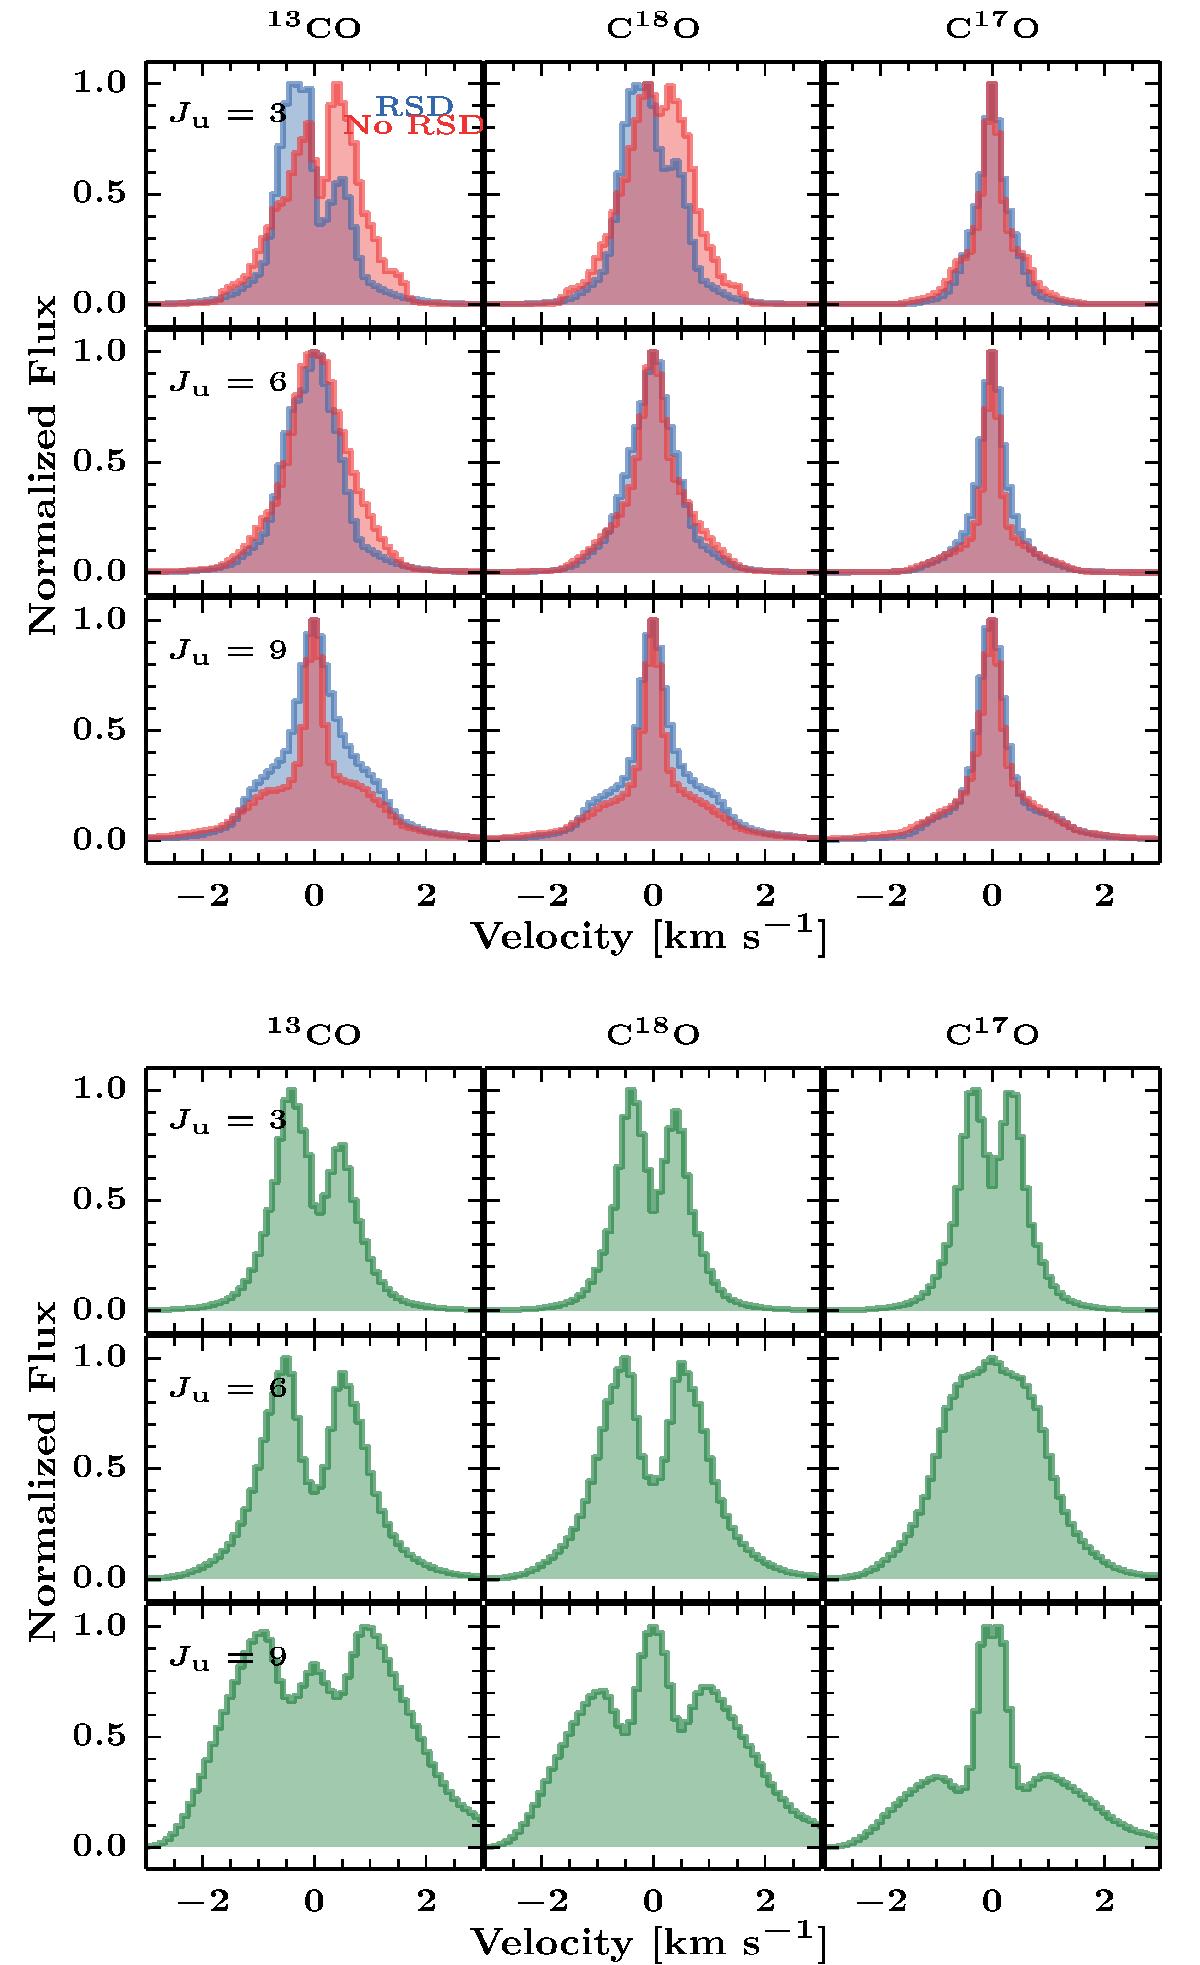
Top: 13CO, C18O, and C17O 3–2 (top), 6–5 (middle), and 9–8 (bottom) spectra at i ~ 0° within a 9″ beam. The blue line shows the synthetic line from simulation with an RSD, while the red line is the simulation without an RSD. Bottom: spectral lines convolved with a 9″ beam simulated from 2D semi-analytical model viewed at face-on orientation.
Current usage metrics show cumulative count of Article Views (full-text article views including HTML views, PDF and ePub downloads, according to the available data) and Abstracts Views on Vision4Press platform.
Data correspond to usage on the plateform after 2015. The current usage metrics is available 48-96 hours after online publication and is updated daily on week days.
Initial download of the metrics may take a while.