Fig. 1
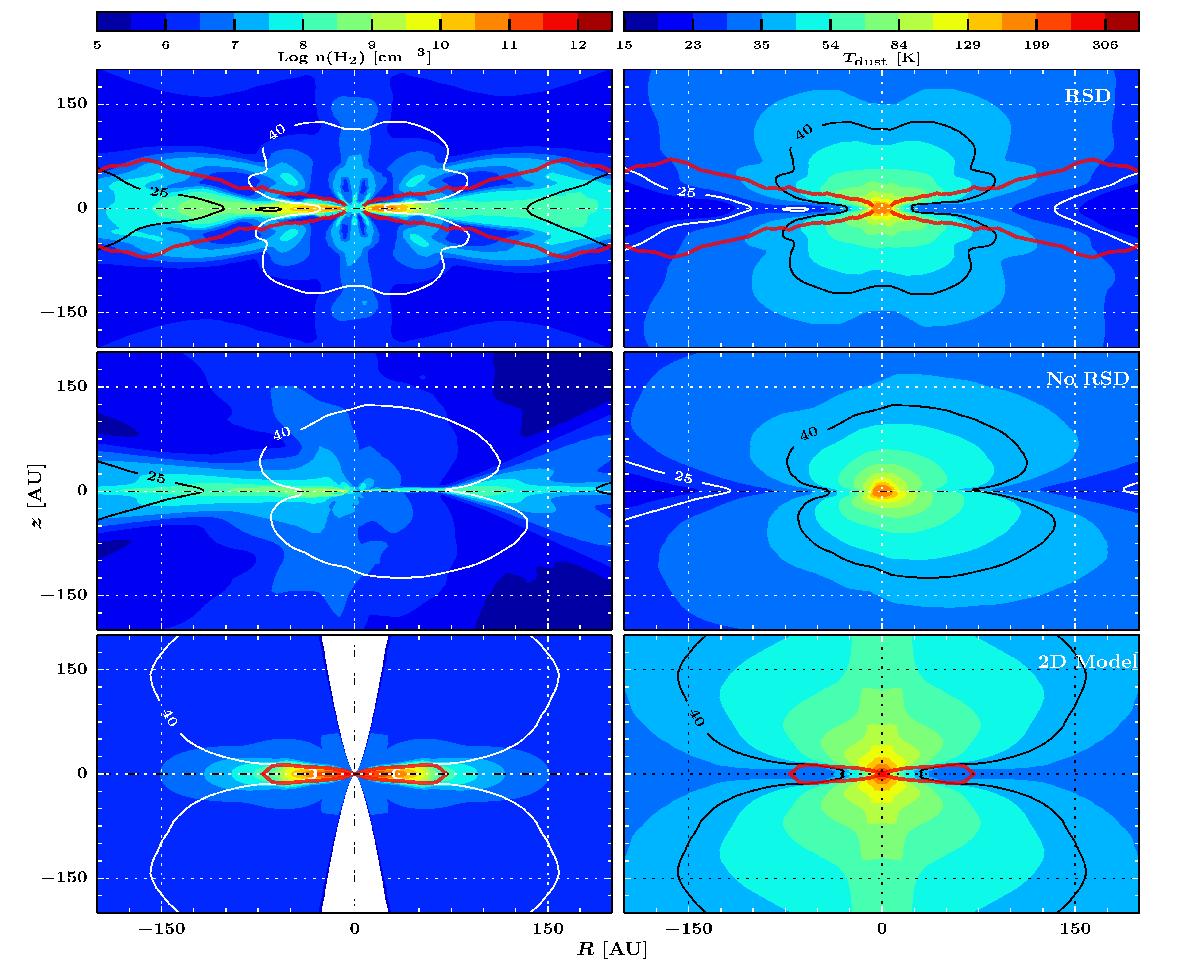
Density and dust temperature structures in the inner 200 AU radius for all three simulations at t ~ 1.2 × 10⁵ years. Temperature contours at 25 K and 40 K are indicated in the right panels. Top: a vertical slice (R − z slice at φ = 0 where R denotes the cylindrical radial coordinate) of the 3D MHD simulation of RSD formation. Middle: a vertical slice of the 3D MHD simulation of a pseudo-disk (no RSD). Bottom: 2D semi-analytical disk formation model. The red lines highlight the region of the stable RSD.
Current usage metrics show cumulative count of Article Views (full-text article views including HTML views, PDF and ePub downloads, according to the available data) and Abstracts Views on Vision4Press platform.
Data correspond to usage on the plateform after 2015. The current usage metrics is available 48-96 hours after online publication and is updated daily on week days.
Initial download of the metrics may take a while.