Fig. 6
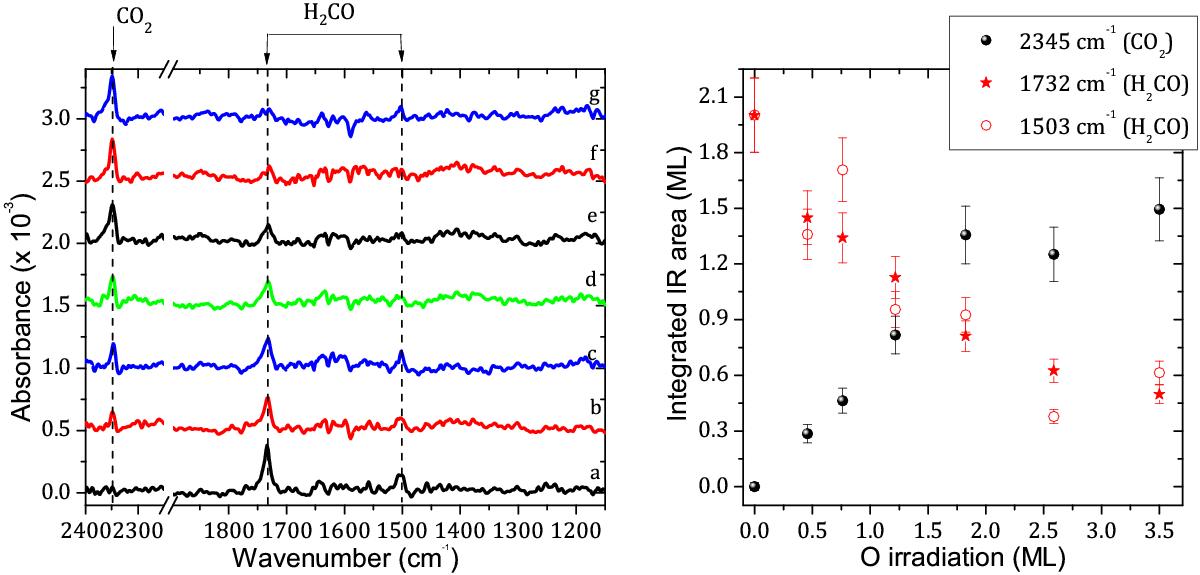
Left panel: seven RAIR spectra obtained after deposition of (a) 2 ± 0.5 ML of H2CO; (b) 2 ± 0.5 ML of H2CO + 0.5 ± 0.1 ML of O atoms; (c) 2 ± 0.5 ML of H2CO + 0.8 ± 0.1 ML of O atoms; (d) 2 ± 0.5 ML of H2CO + 1.2 ± 0.2 ML of O atoms; (e) 2 ± 0.5 ML of H2CO + 2.0 ± 0.3 ML of O atoms; (f) 2 ± 0.5 ML of H2CO + 2.8 ± 0.3 ML of O atoms; (g) 2 ± 0.5 ML of H2CO + 3.8 ± 0.3 ML of O atoms, on a ASW ice held at 55 K (H2CO was always deposited at 60 K). Right Panel: integrated areas of the H2CO and CO2 bands as a function of O-atom dose.
Current usage metrics show cumulative count of Article Views (full-text article views including HTML views, PDF and ePub downloads, according to the available data) and Abstracts Views on Vision4Press platform.
Data correspond to usage on the plateform after 2015. The current usage metrics is available 48-96 hours after online publication and is updated daily on week days.
Initial download of the metrics may take a while.