Fig. C.1
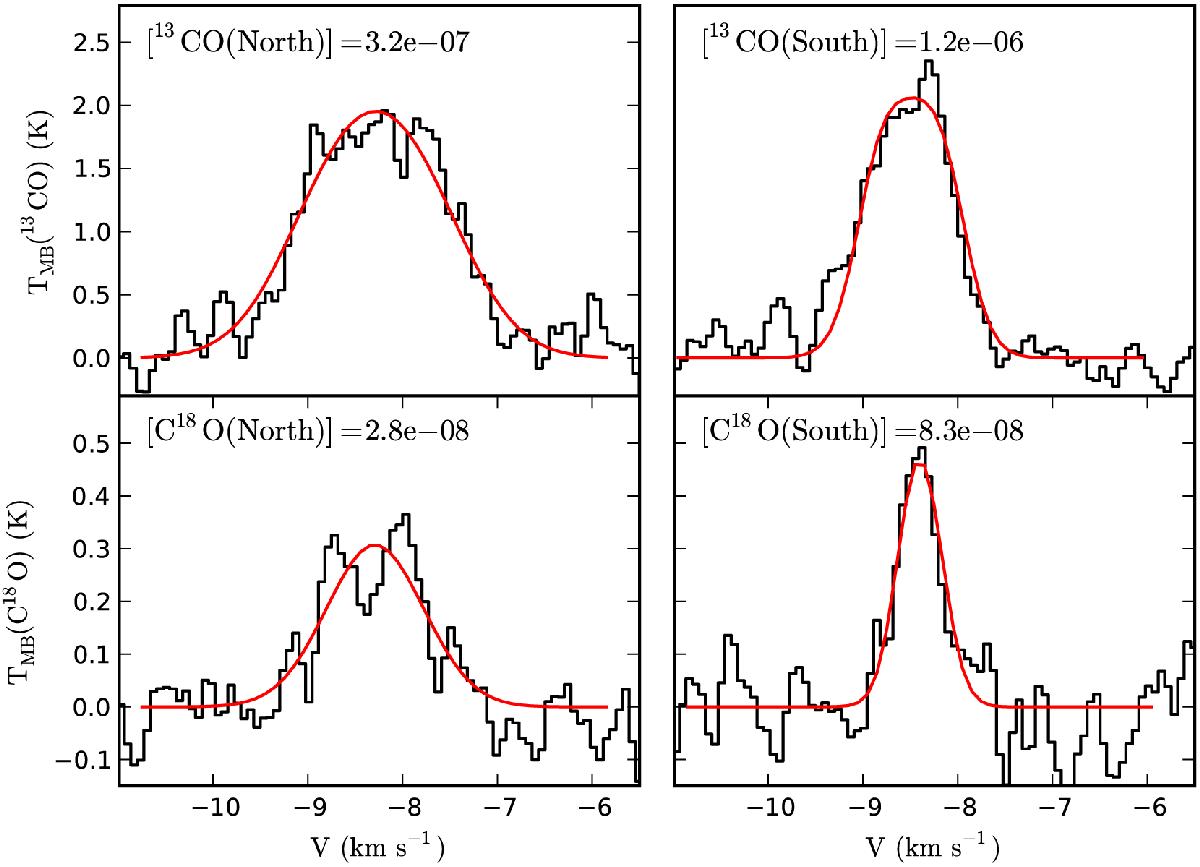
Examples of the modeled 13CO (upper frames) and C18O spectra (lower frames) for the northern (left frames) and southern (right frames) positions in the field G131.65+9.75. The histograms show the observed spectra and the continuous red lines the model predictions. The model densities were derived from continuum modeling with OH dust, assuming a narrow LOS density profile.
Current usage metrics show cumulative count of Article Views (full-text article views including HTML views, PDF and ePub downloads, according to the available data) and Abstracts Views on Vision4Press platform.
Data correspond to usage on the plateform after 2015. The current usage metrics is available 48-96 hours after online publication and is updated daily on week days.
Initial download of the metrics may take a while.