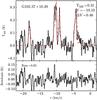
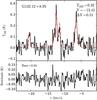
Fig. B.1
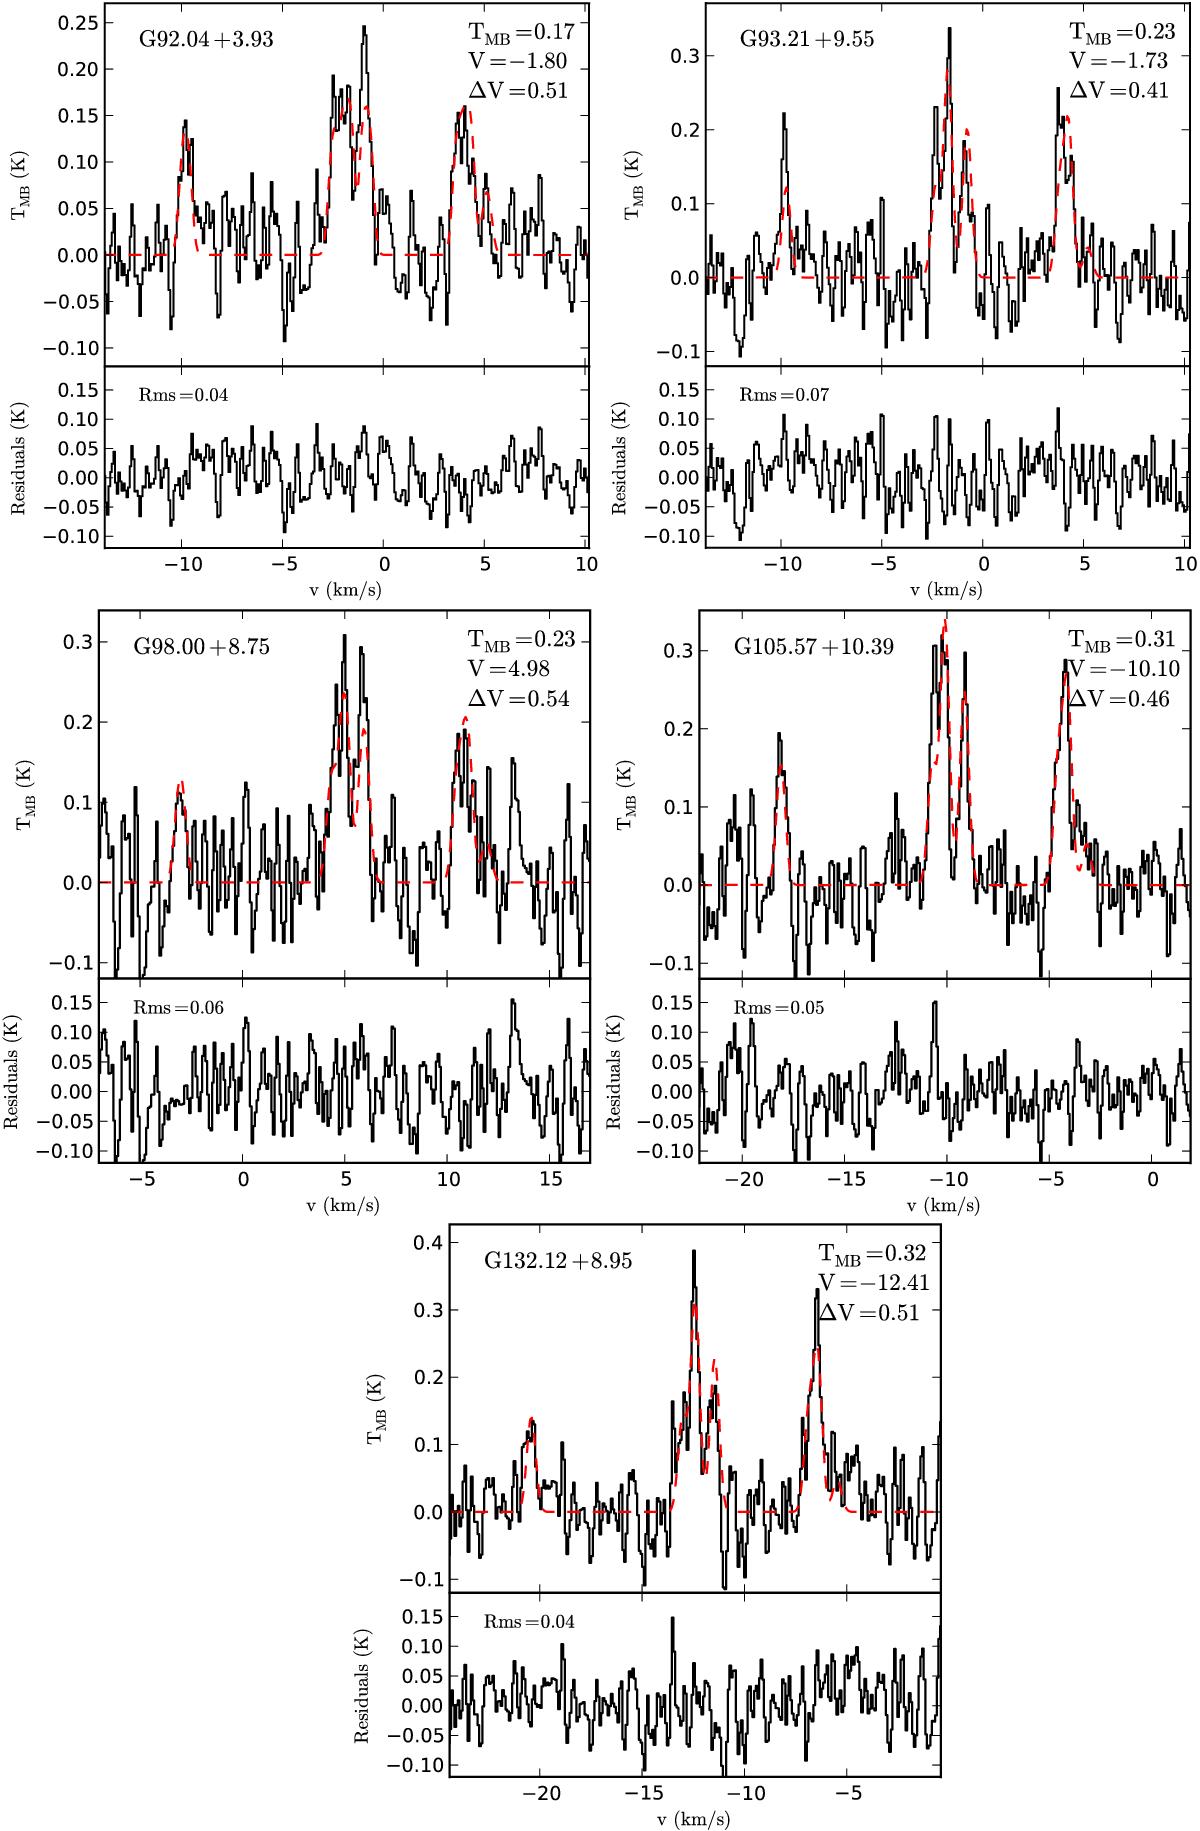
N2H+ spectra observed toward G92.04+3.93, G93.21+9.55, G98.00+8.75, G105.57+10.39, and G132.12+8.95. The field G86.97–4.06 is shown in Fig. 3. The red dashed line is the fit to the hyperfine spectra and the lower subframe shows the fit residuals. The main beam temperature of the 23−12 component, the fitted radial velocity, the FWHM line width (km s-1), and the residual rms noise (as main beam temperature) are given in the frames.
Current usage metrics show cumulative count of Article Views (full-text article views including HTML views, PDF and ePub downloads, according to the available data) and Abstracts Views on Vision4Press platform.
Data correspond to usage on the plateform after 2015. The current usage metrics is available 48-96 hours after online publication and is updated daily on week days.
Initial download of the metrics may take a while.