Free Access
Fig. 2
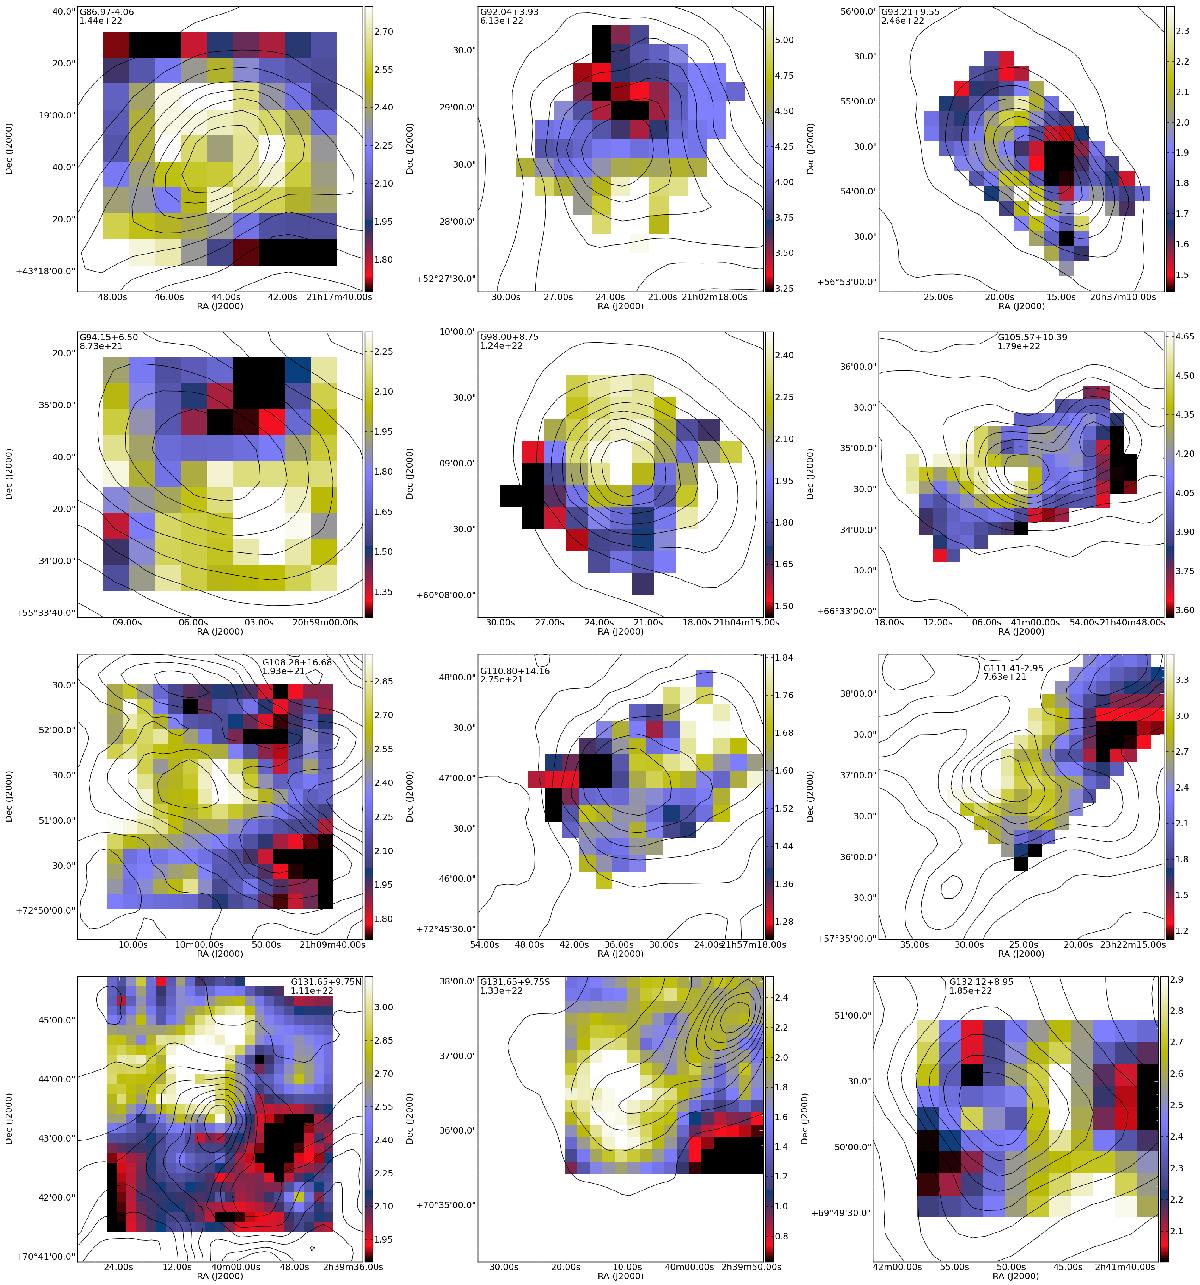
Maps of 13CO main beam temperature (Tmb [K], resolution 35″). The contours show the column density derived from dust continuum observations (resolution 40″), with contour steps 10% of the peak value. The name of the field and the maximum value of N(H2) derived from dust emission are marked in each frame.
Current usage metrics show cumulative count of Article Views (full-text article views including HTML views, PDF and ePub downloads, according to the available data) and Abstracts Views on Vision4Press platform.
Data correspond to usage on the plateform after 2015. The current usage metrics is available 48-96 hours after online publication and is updated daily on week days.
Initial download of the metrics may take a while.