Fig. 6
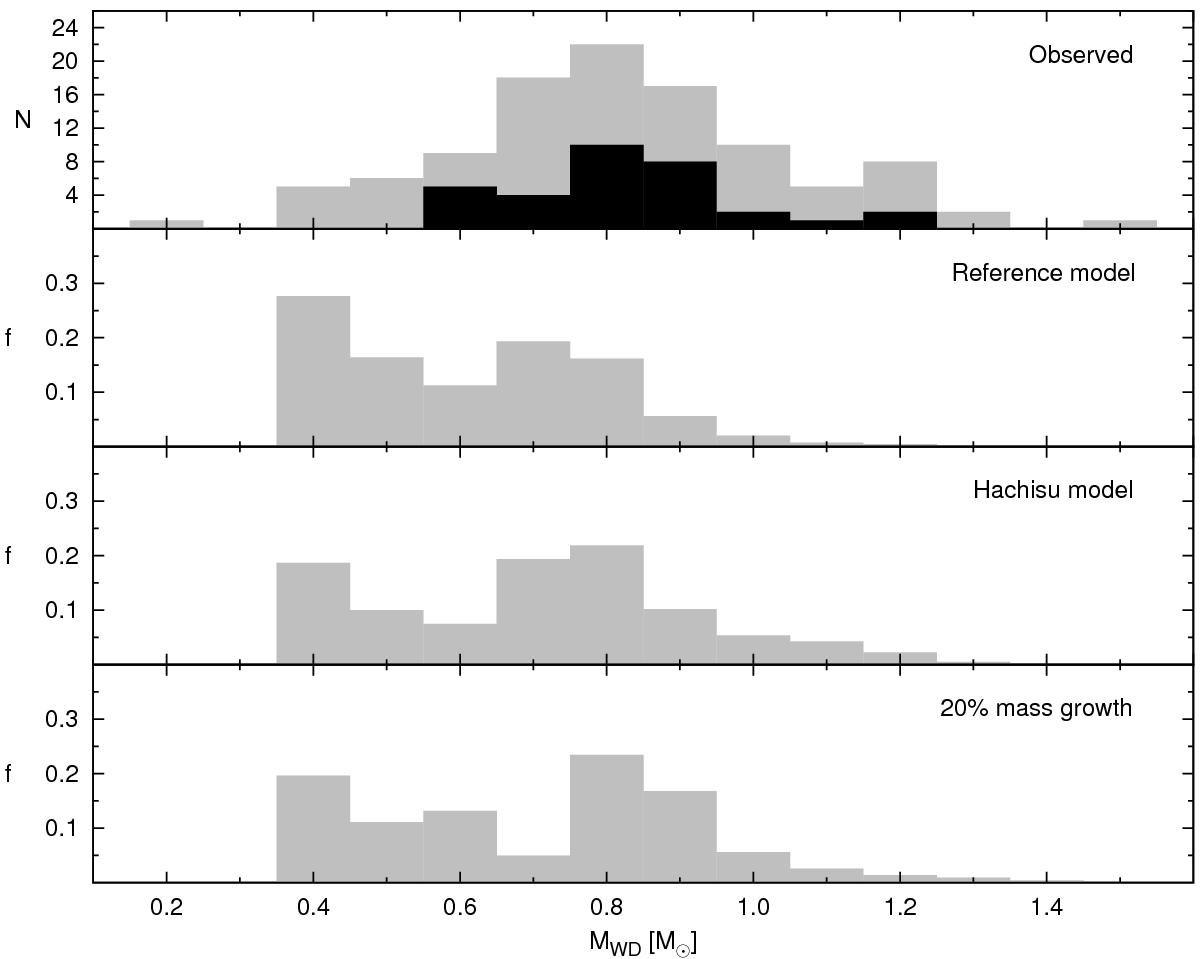
Mass distribution of WDs in CVs for the different models described in this work and the distribution derived from observations. From top to bottom: observed sample used in Zorotovic et al. (2011) with the black histogram representing a sub-sample for which the mass determination is presumably more reliable, distribution predicted by our reference model, distribution derived from the reference model including a strong wind during TTMT, distribution predicted if it is assumed that 20% of the transferred mass during a nova cycle remains on the WD. The fractions are normalized to the total formation probability of all CVs in each model.
Current usage metrics show cumulative count of Article Views (full-text article views including HTML views, PDF and ePub downloads, according to the available data) and Abstracts Views on Vision4Press platform.
Data correspond to usage on the plateform after 2015. The current usage metrics is available 48-96 hours after online publication and is updated daily on week days.
Initial download of the metrics may take a while.