Fig. 2
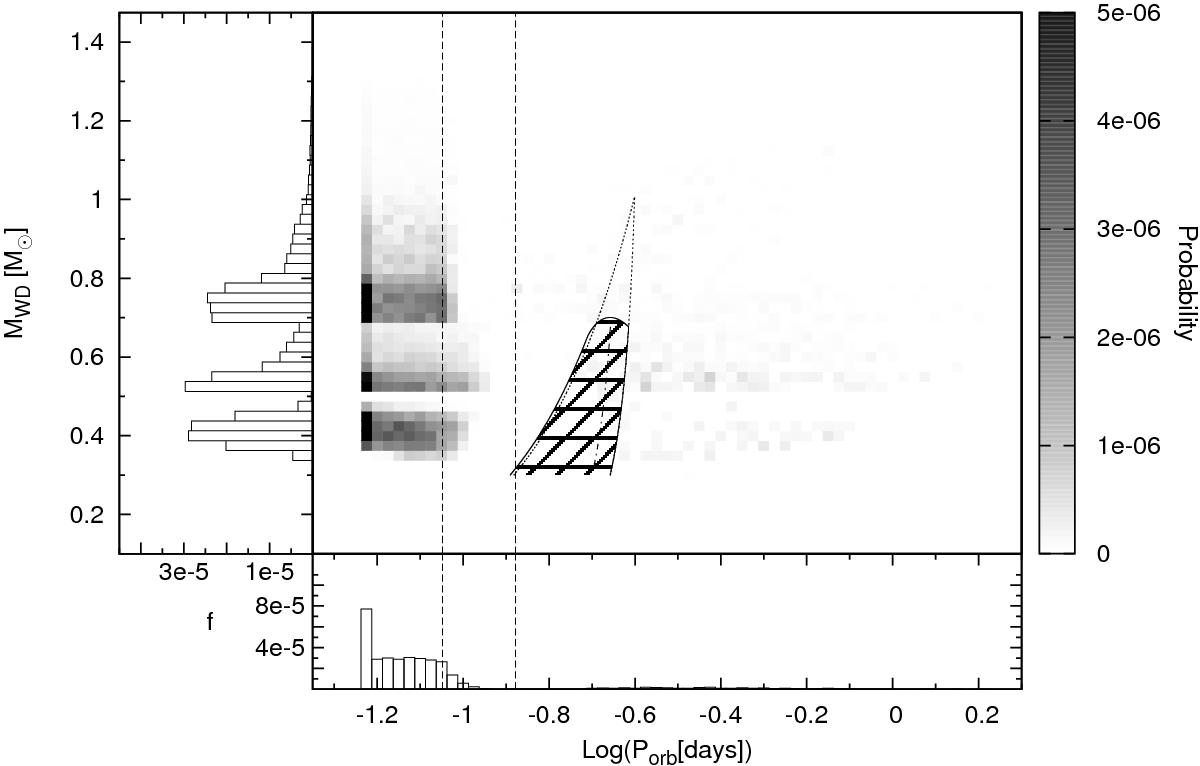
Centre: two-dimensional histogram of the orbital period and WD mass distributions in CVs for our reference model. The colour intensity represents the sum of the formation probabilities of all CVs residing in that two-dimensional bin. The vertical dashed lines mark the upper (3.18 h) and lower edge (2.15 h) of the observed period gap (Knigge 2006). The hatched region indicates the parameter space in which mass transfer will become dynamically unstable, assuming qcr is given as in Eq. (1). The dotted line marks the shape of the dynamically unstable region if one assumes a constant qcr of 0.695 for M2 ≲ 0.7 M⊙. These regions are depicted in the same way as their corresponding regions in Fig. 1. The dashed-dotted line marks the region where mass transfer becomes dynamically unstable if one assumes the ZAMS mass-radius from Tout et al. (1996). Bottom panel: orbital period distribution of the CVs in our reference model. Left panel: WD mass distribution of the CVs in our reference model.
Current usage metrics show cumulative count of Article Views (full-text article views including HTML views, PDF and ePub downloads, according to the available data) and Abstracts Views on Vision4Press platform.
Data correspond to usage on the plateform after 2015. The current usage metrics is available 48-96 hours after online publication and is updated daily on week days.
Initial download of the metrics may take a while.